Scale-Independent Query Processing With PIQL

Michael Armbrust

(This is joint work with Kristal Curtis and Tim Kraska.)

The Internet is littered with stories of traditional relational database failing to meet the performance needs of fast growing internet sites.  The story usually goes as follows: Everything works great when the site is small. Suddenly, the site becomes popular and queries start running slowly. As a result, the developers abandon the relational database and switch to writing queries imperatively against a distributed key/value store.  Examples of sites that use distributed key/value stores under the covers include digg, facebook, and twitter, along with many others.

One key driver of this NoSQL movement is the fact that the data independence provided by an RDBMS actually exacerbates the scaling problem by hiding potentially expensive queries behind the relative simplicity of high-level declarative queries.  In contrast, the simple get/put interface of most NoSQL stores provides predictable per-operation performance, independent of the size of the underlying database.

The NoSQL ‘solution,’ however, leads to its own set of problems.  The use of imperative functions instead of declarative queries means that changes to the data model often require time-consuming rewrites.  Additionally, developers have to manually parallelize key/value store requests or suffer delays due to sequential execution. In other words, the benefits of physical and logical data independence are lost.

Instead, we propose PIQL (pronounced pickle), the Performance-Insightful Query Language.  In addition to the physical and logical data independence provided by a traditional system, PIQL ensures the scale independence of all queries in an application at compile time.  A scale-independent query is guaranteed to perform only a bounded number of operations no matter how large the underlying database grows.

Some systems, for example Google AppEngine’s GQL, impose severe functional restrictions, such as removing joins, in order to ensure scalability. In contrast, PIQL employs language extensions, query compilation technology, and response-time estimation to provide scale independence over a larger and more powerful subset of SQL.

We evaluated our ideas by building a prototype on top of SCADS, a distributed key/value store first proposed at CIDR 2009.  Using this prototype we constructed two benchmarks, one based on Twitter and the other on the user-facing queries from TPC-W.
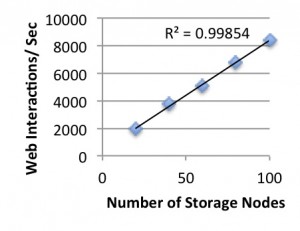
The throughput of the system while running the TPC-W benchmark increases linearly as machines are added to the cluster.

As the above figure shows, systems built using PIQL scale linearly as machines are added while keeping response time constant.  If you’d like to learn more, you can check out our paper appearing in VLDB2012 or look at some of the queries written in our LINQ-like Scala DSL.

Latencies Gone Wild!

gpang

Cloud services are becoming popular for large-scale computing and data management.  Amazon EC2 is a commonly used cloud service by many individuals and companies, and has clusters in 5 different regions: US East, US West, EU, Asia (Singapore) and Asia (Tokyo).  However, failures can happen, even to entire clusters and regions.  Amazon suffered a failure for several days in the east region in April 2011.  Eventually most services were restored, but 0.4% of database data could not be restored and was lost.  Therefore, if distributed systems must be highly available, they must be replicated across data centers.  In addition, no data loss and higher levels of consistency can only be achieved through synchronous replication.

Since spanning multiple regions is important for reliable distributed systems, the latencies of network messages are affected by the long distances.  When two machines across the country or the globe need to communicate, the speed of light limits the lower bound of network latencies.  For example, if 4,000 kilometers span between California and Virginia, the speed of light dictates that the theoretical lower bound of any round trip message is at least 26 milliseconds.  RPCs within a single data center usually take less than 1 millisecond to complete, but RPCs to different regions are expected to take around 100 milliseconds or more.We ran a few experiments on EC2 to measure cross data center message delays to get a better idea of how different regions affect the latencies.

For the first experiment, we measured simulated 2048-byte echo RPCs between two machines in 3 different scenarios: both machines in the same data center, both machines in the same region, but different data centers, and both machines in different regions.

Data Center Labels:
west1 – data center 1 in the US West region
west2 – data center 2 in the US West region
east1 – data center 1 in the US East region
west1west1 west1west2 west1east1
average 0.68 ms 1.68 ms 83.11 ms
99th percentile 0.88 ms 1.90 ms 83.68 ms

From the numbers, it is obvious that network latencies between the west and east coast of the US are about 2 orders of magnitude longer than latencies within a single data center.

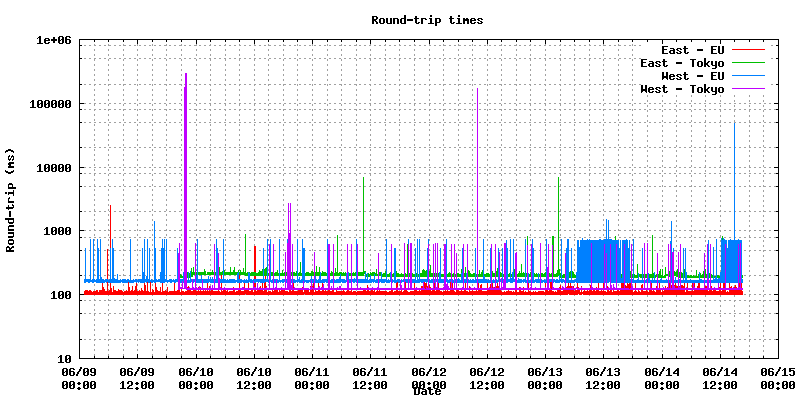
Our second experiment measured latencies between some of the other regions for longer periods of time.  We collected latency measurements for about a week for RPCs between different regions.

The 4 cross-regions tested:
East (US) – EU (Ireland)
East (US) – Tokyo
West (US) – EU (Ireland)
West (US) – Tokyo
This shows that the latencies between distant regions can vary wildly.  There were some spikes of RPCs which took longer than a minute and there were periods of time when the latencies were consistently almost a second long.

These experiments show that the message delays can have a lot of variation and spikes of high latencies can be expected for cross data center network traffic.  Globally reliable systems will need to expect longer network message delays, and deal with them.  Common techniques either suffer data loss, or do not handle the longer latencies to achieve good performance.  New solutions will have to be developed in order to provide fault tolerant, reliable, globally distributed systems with usable performance.  Stay tuned for details on our new project addressing this issue.

Crowdsourcing and bursts in human dynamics

faridani

Crowdsourcing labor markets like Amazon Mechanical Turk are now being used by several companies. For example castingwords uses Mechanical Turk for transcribing audio and video files. Card Munch uses the crowd to insert the contents of business cards into iPhone address books.

But how long will it take for Card Munch to convert a batch of 200 cards into a digital address book, or how long should castingwords wait to get back the transcription of 100 audio files from Mechanical Turk?

This is a stochastic process. First, it depends on how many workers (a.k.a Turkers) are available on Mechanical Turk. Secondly, it depends on what other competing works are available on this market. Nobody wants to transcribe a long audio file for $6 if they can work on easier $6 tasks.  In other words everybody has some kind of a utility function in mind that they like to maximize. Some want to earn more money in a shorter time; others may want to work on interesting jobs. Regardless of the form of this utility function it is less likely that workers will work on your task if there are more appealing tasks on the market. That’s what we are as humans, selfish utility maximizers!

An interesting property of the Mechanical Turk market is that workers select their tasks from two main queues: “Most recently posted” and “Most HITs available”. This results in an interesting behavior in terms of completion times for a task: They are distributed according to a power-law: While many tasks get completed relatively quickly, some others starve. When you post your task with 100 subtasks, say 100 business cards that need to be digitized, the task appears on top of the “new tasks” list, more people notice that and more people work on it. You may get 70 of your subtasks completed in few minutes. But as other requesters post their tasks on the market, your task goes down in the new tasks list and fewer people see it. The completion rate goes down dramatically. By the time your task drops to the fifth page of the list you will be lucky if people notice your task at all. This is why many consider canceling their task at this point and repost them just to appear on the first page of task lists.

When we see such priority queues (in this case the list of “new tasks”) we see similar behaviors of task completion times. In fact we all have an intuitive understanding of the effect of the priority queue. We click on the top link on the first page of Google search results more often that a link that appears on the 10th page. See Barabasi’s article in Nature on this phenomenon (also see the supplementary material on this website in case you are interested in the underlying queuing theory).

Human behavior is hard to predict and to answer our completion time question we need to unlock this fascinating long tail complexity. This is an ongoing research project in the community. And so far I have approached this problem from two different perspectives: One, using a statistical technique called survival analysis (specifically, the Cox proportional hazards model), I’ve also explored the idea of Turkers as utility maximizes. Interested readers can refer to this paper. I’d like to highlight that this work is still at the early stages, and I will write more about the extensions of these works in future blog posts.