
A critical part of enabling cities to implement their Vision Zero policies – the goal of the current National Transportation Data Challenge – is to be able to generate open, multi-modal travel experience data. While existing datasets use police and hospital reports to provide a comprehensive picture of fatalities and life altering injuries, by their nature, they are sparse and resist use for prediction and prioritization. Further, changes to infrastructure to support Vision Zero policies frequently require balancing competing needs from different constituencies – protected bike lanes, dedicated signals and expanded sidewalks all raise concerns that automobile traffic will be severely impacted.
A timeline of the El Monte/Marich intersection in Mountain View, from 2014 to 2017 provides an opportunity to put some of these challenges into context.

- since there is no standard way to report near misses, the City didn’t know that the intersection was so dangerous until somebody actually died, and it was not included in the ped and bike plans,
- because the number of fatalities is so low, and the number of areas that need to be fixed is so high, past fatalities may not be a good predictors of future ones. But that makes prioritization challenging – should the City play “whack-a-mole” with locations where fatalities occurred, or should it stick with the ped and bike plans?
- even if the City does pick an area to fix, it is not clear what the fix should be. Note that the City wanted to improve the visibility of the intersection, but the residents were skeptical that any solution that did not address the speeding would be sufficient.
- it is not clear how to balance competing needs – addressing the speeding issue will potentially increase the travel times of (the currently speeding) automobile travellers. Increased travel time is quantifiable, how can we make the increased safety also quantifiable so that we can, as a society, make the appropriate tradeoffs?
The e-mission project in the RISE and BETS labs focuses on building an extensible platform that can instrument the end-to-end multi-modal travel experience at the personal scale, collate it for analysis at the societal scale, and help solve some of the challenges above.
In particular, it combines background data collection of trips, classified by modes, with user-reported incident data, and makes the resulting anonymized heatmaps available via public APIs for further visualization and analysis. The platform also has an integration with the habitica open source platform to enable gamification of data collection.
-
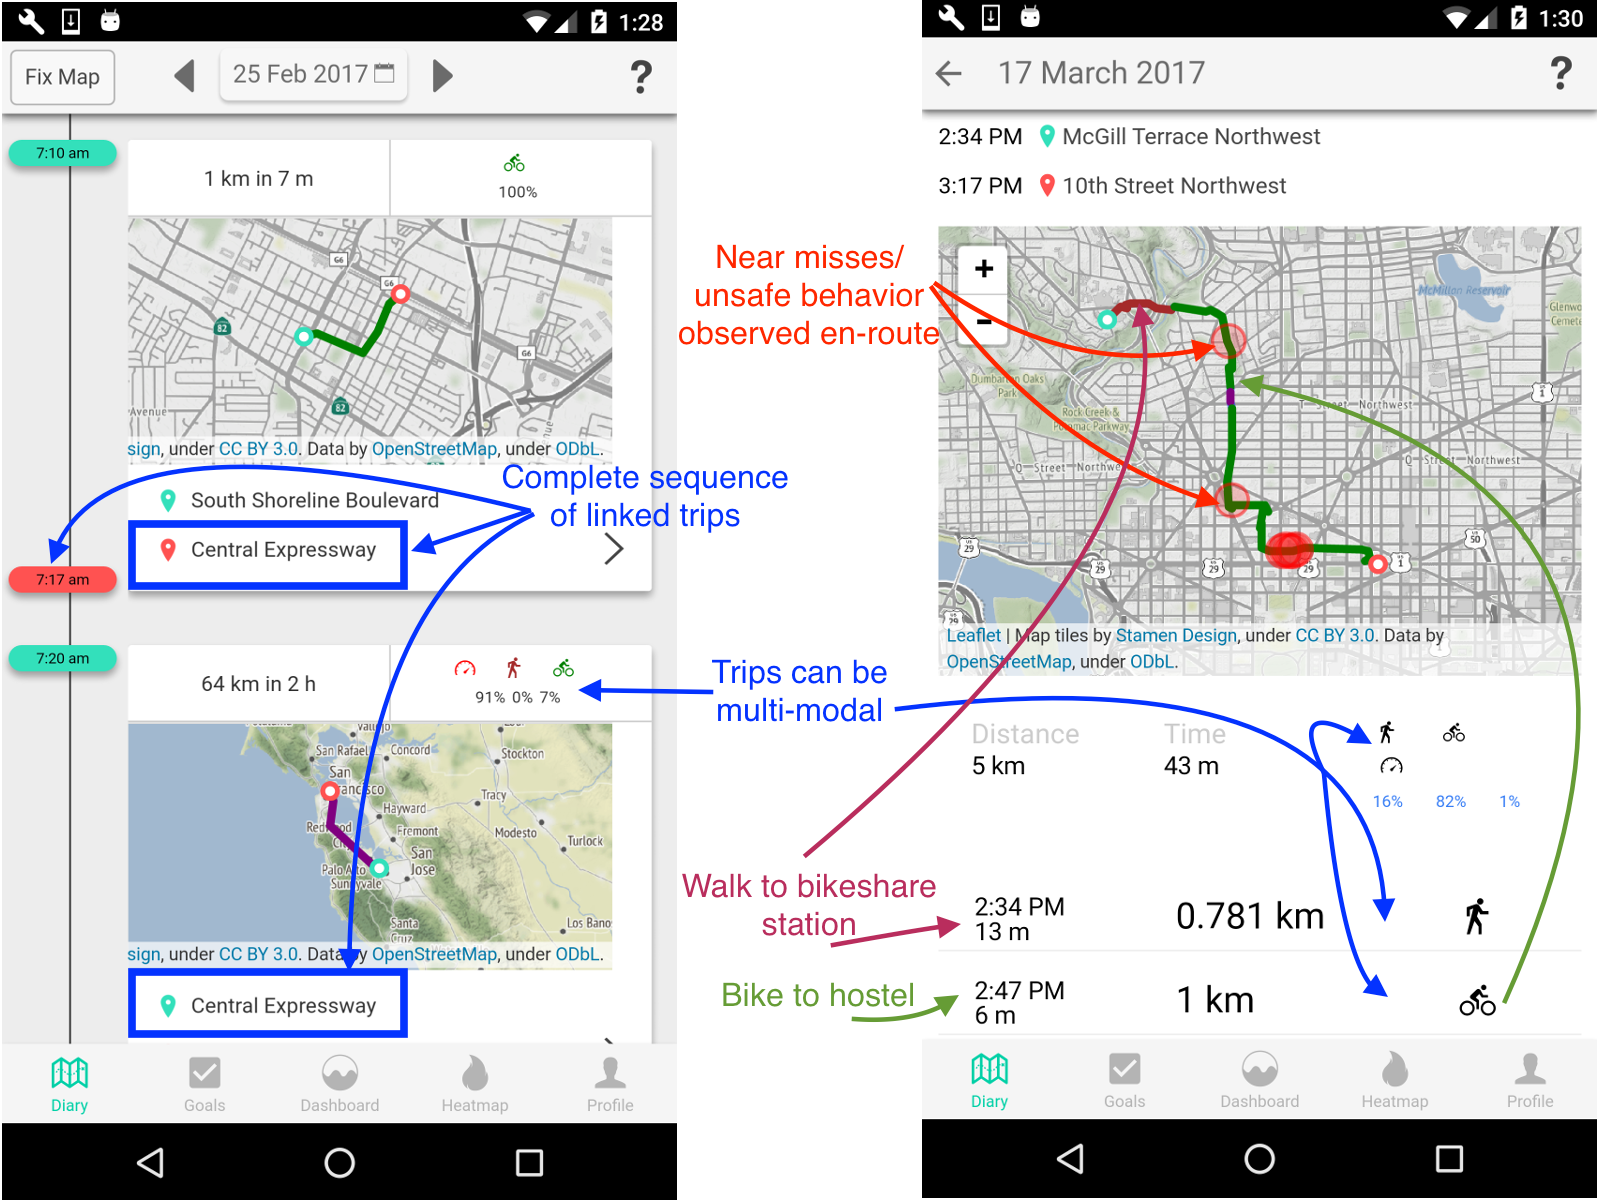
- background data collection of trips and user reported incident data
-
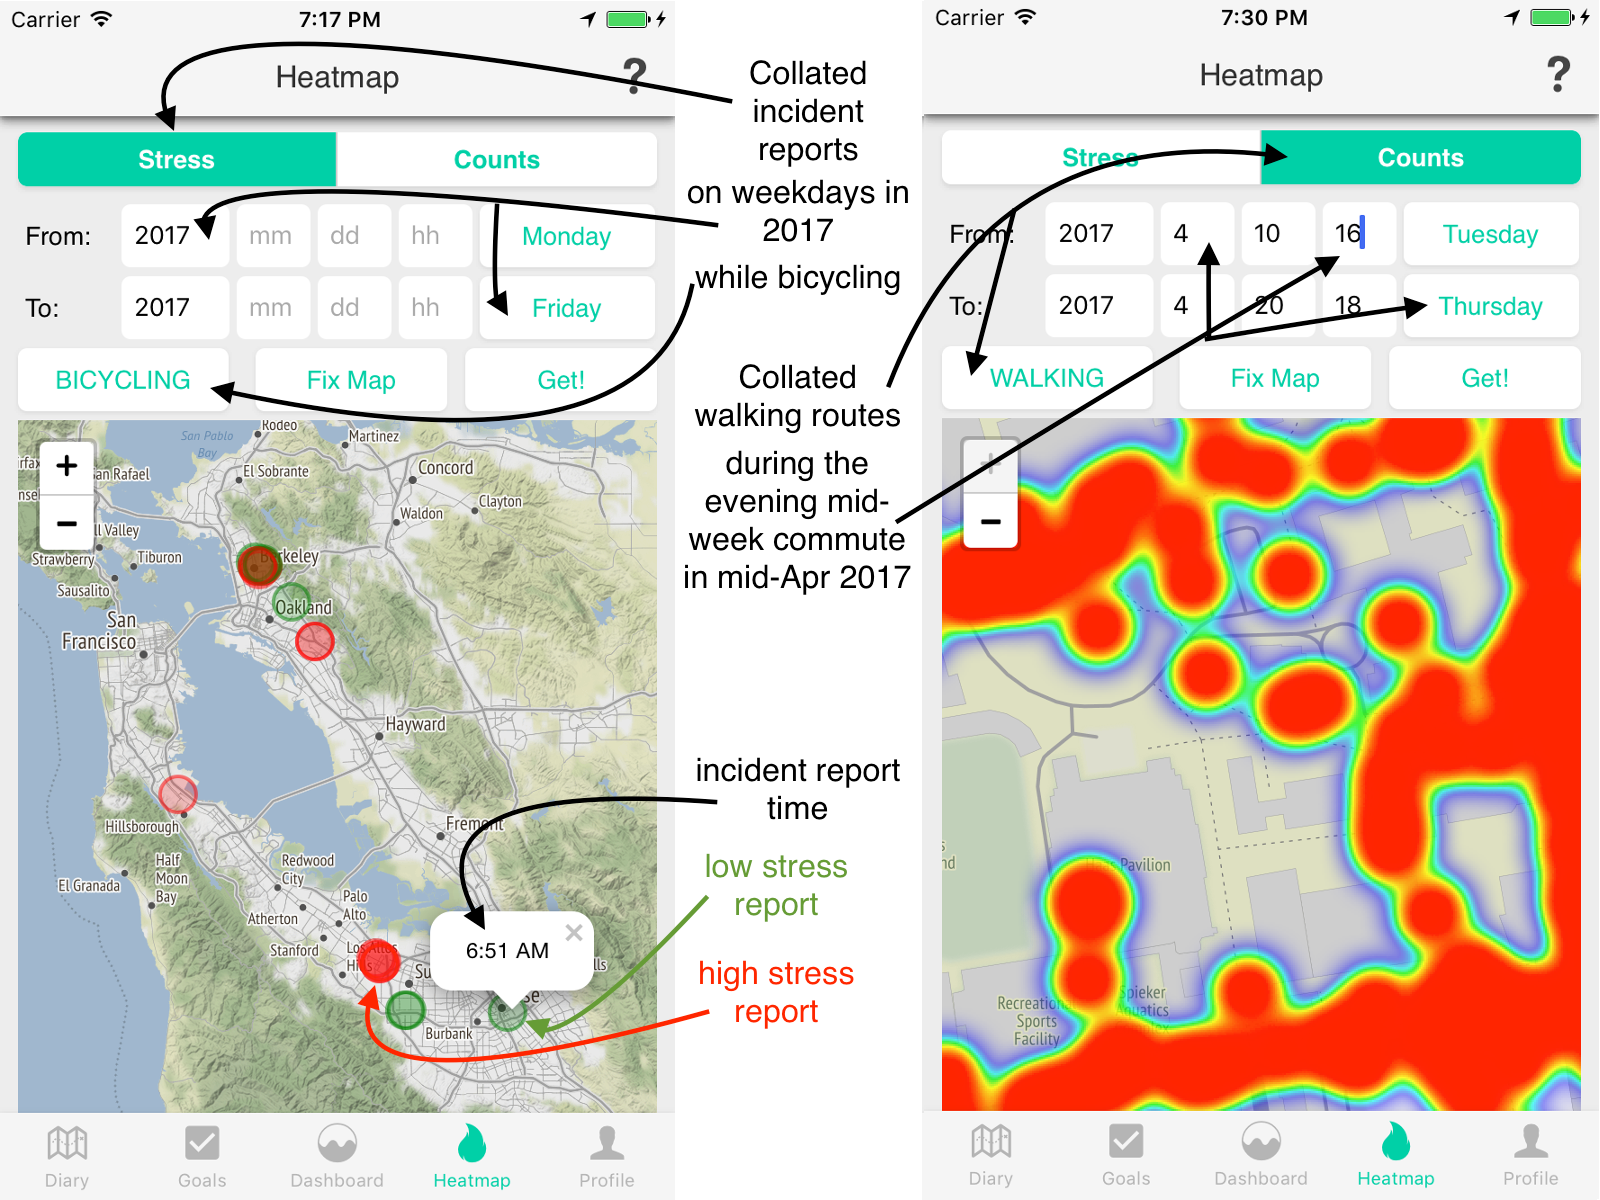
- heatmaps for counting trips and visualizing stress
-
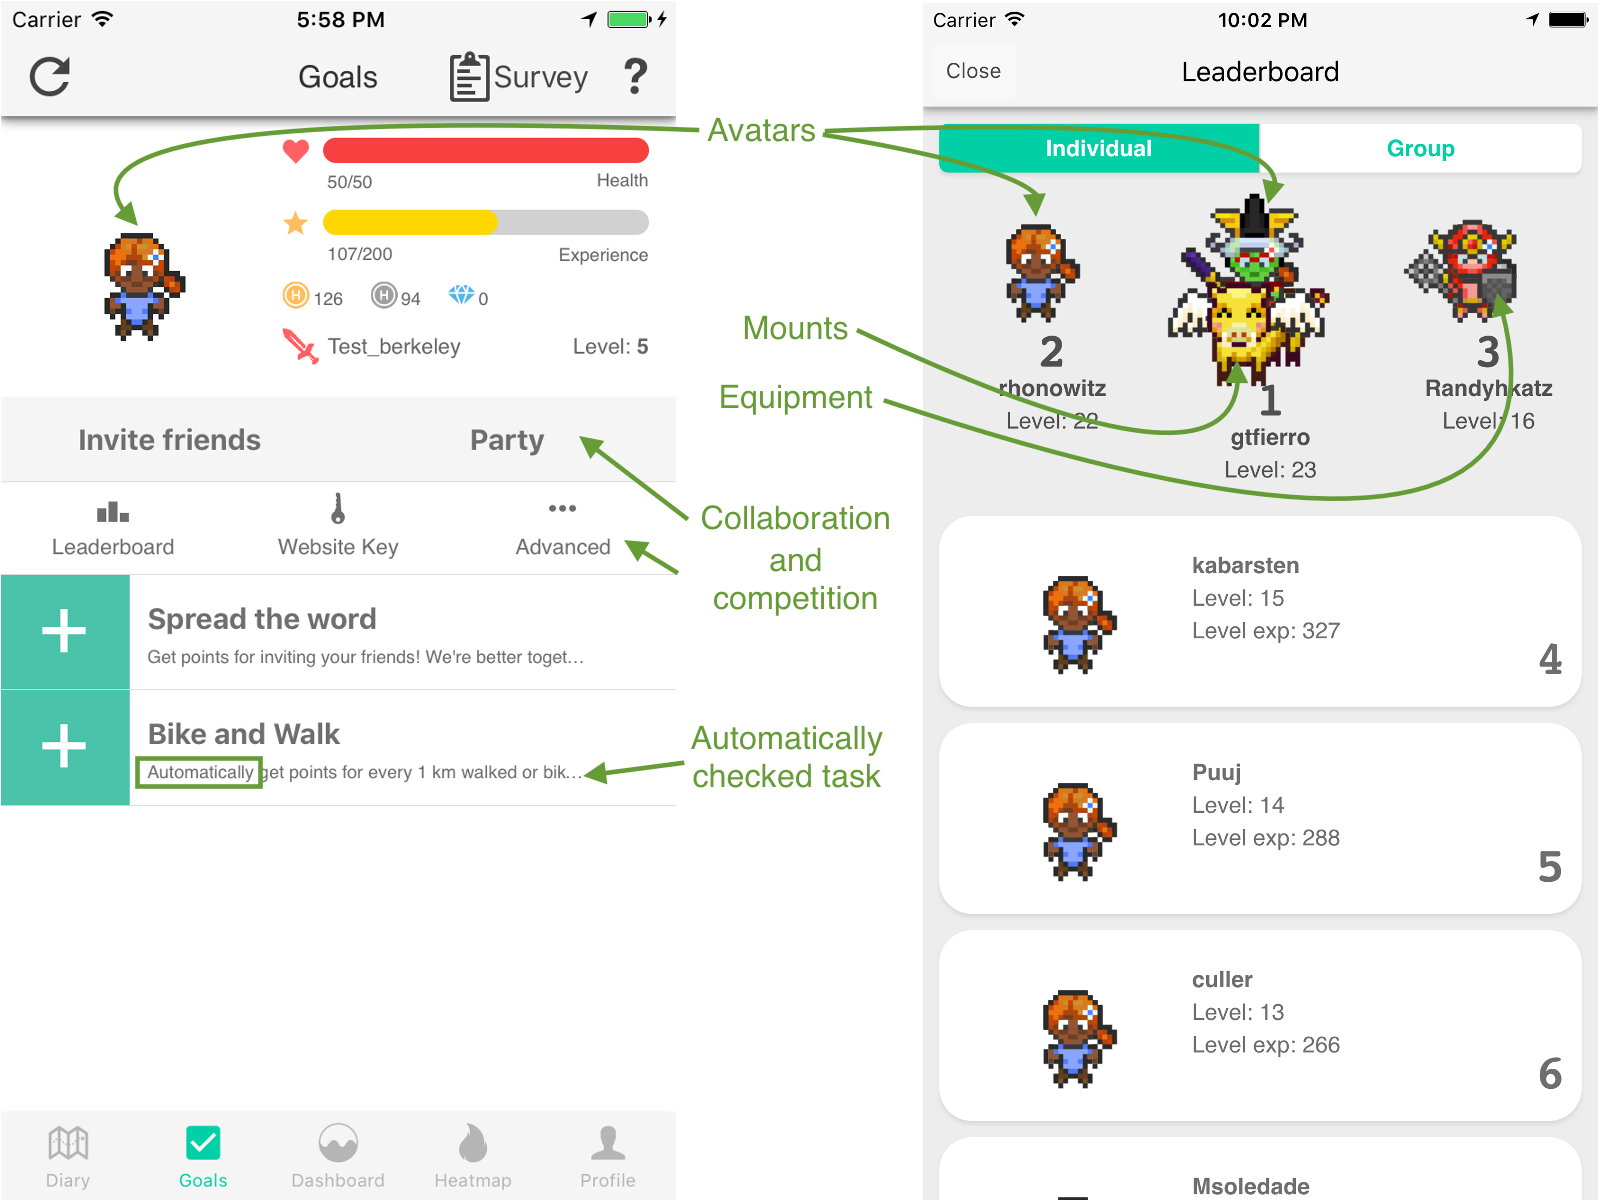
- habitica integration automatically gives points for every km walked and biked
-
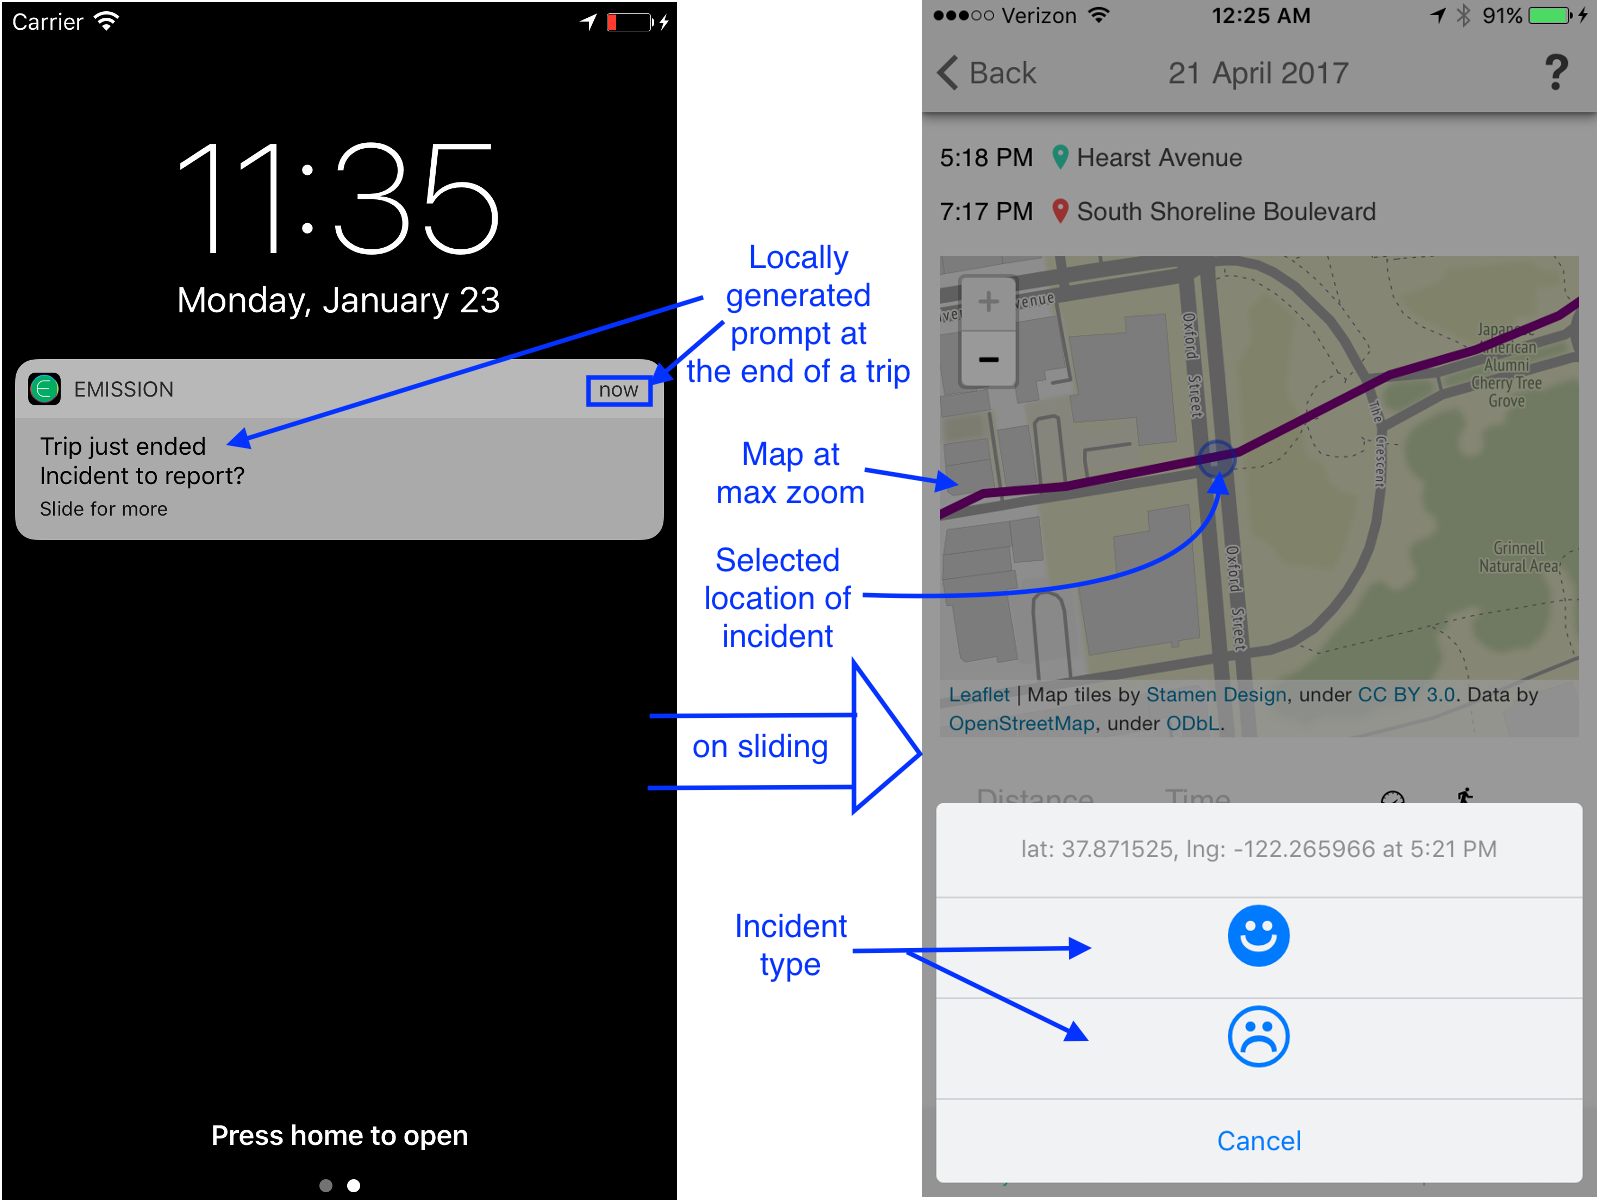
- users are prompted at the end of every trip to report incidents
-
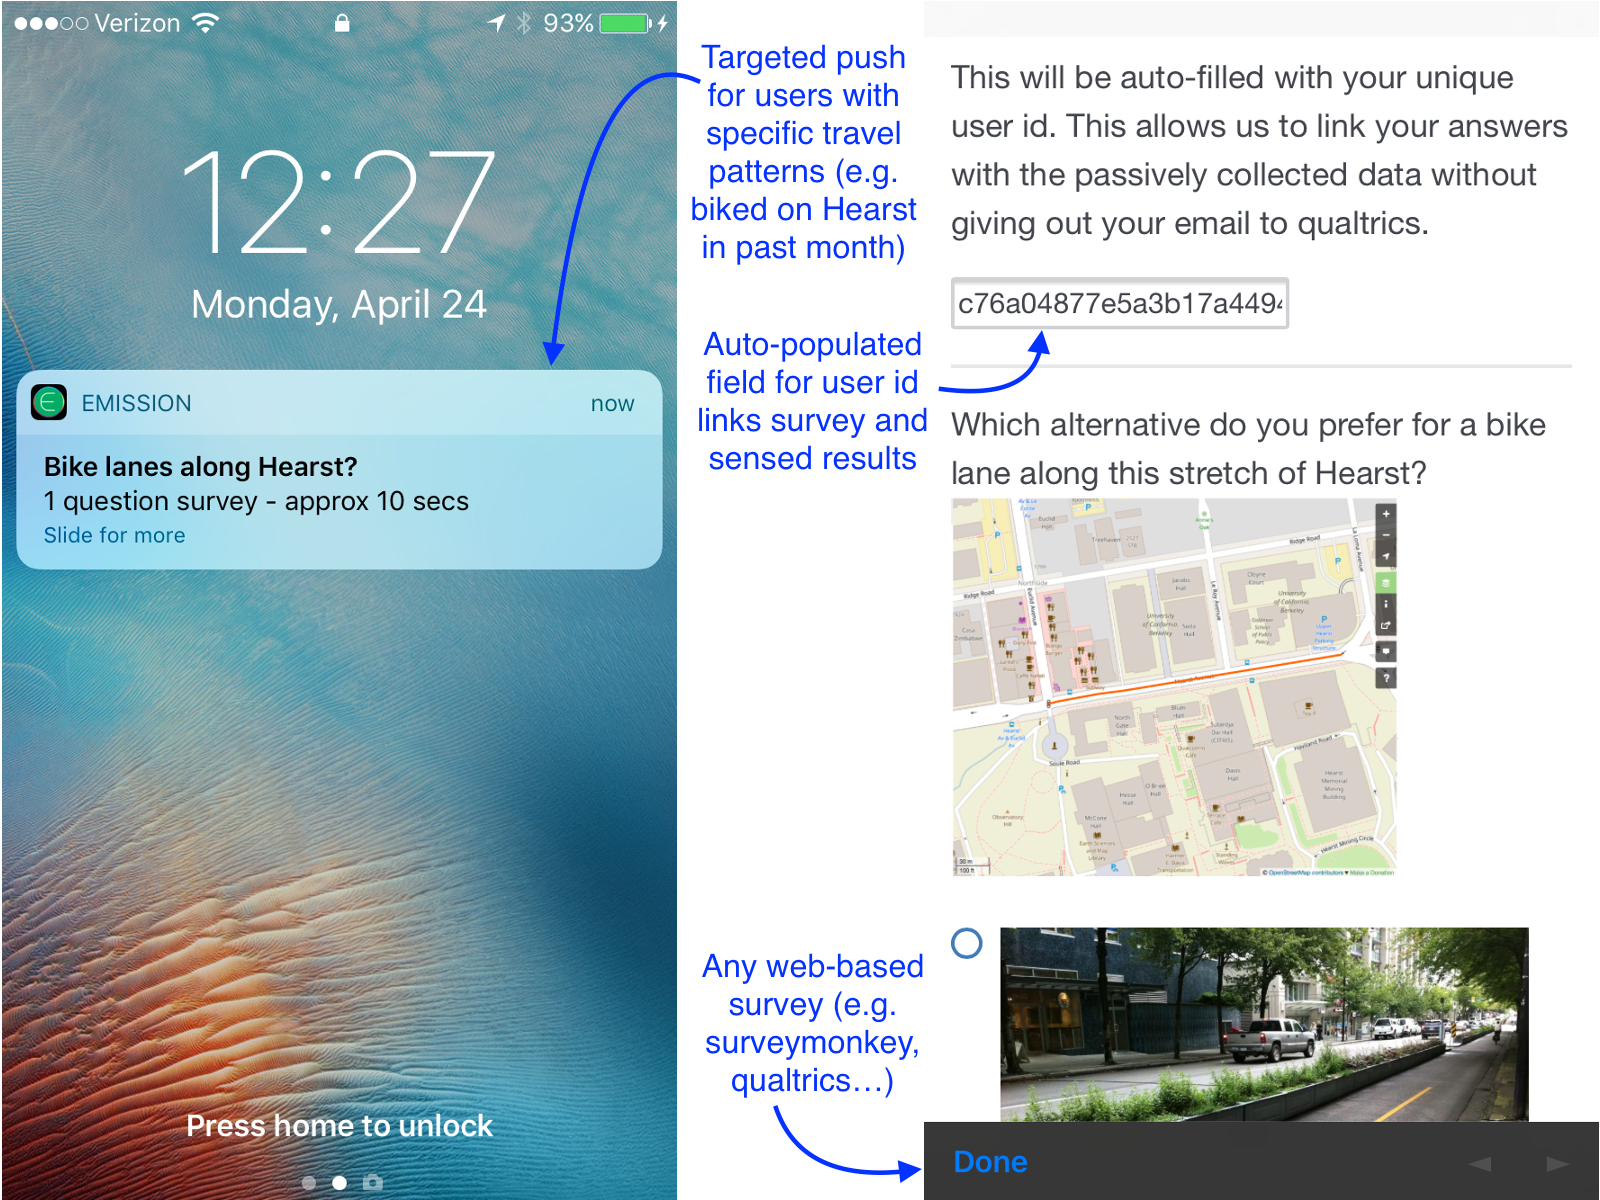
- targeted surveys can be sent to regular users to capture public input
-
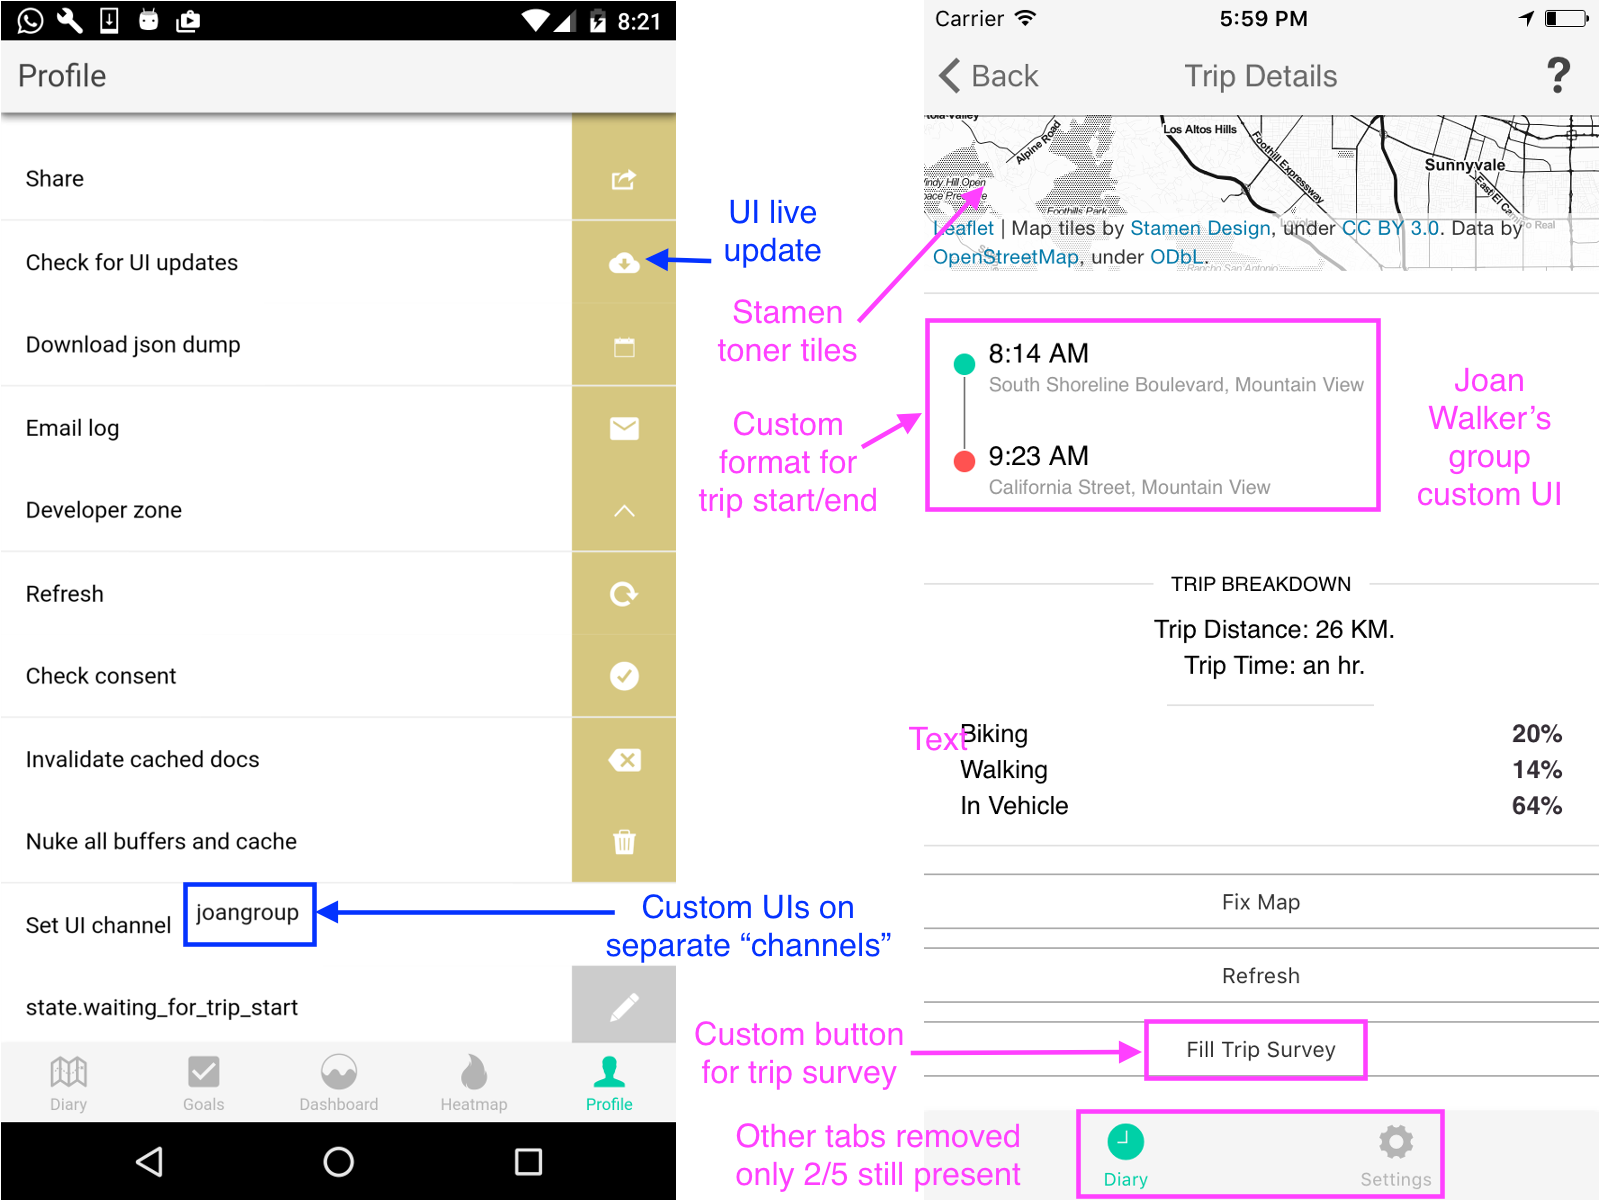
- customizing the UI while retaining native functionality is simple
This could allow cities to collect crowdsourced stress maps, use them to prioritize the areas that need improvement, and after pilot or final fixes are done, quantify the reduction in stress and mode shifts related to the fix.
Since this is an open source, extensible platform and generates open data, it can easily be extended to come up with some cool projects. Here are five example extensions to give a flavor of what improvements can be done:
- enhance the incident reporting to provide more details (why? how serious?)
- have the incident prompting be based on phone shake instead of a prompt at the end of every trip
- encourage reporting through gamification using the habitica integration
- convert the existing heatmaps to aggregate, actionable metrics
- automatically identify “top 5” or “top 10” hotspots for cities to prioritize
But these are just examples – the whole point of the challenge is to tap into all the great ideas that are out there. Sign up for the challenge, walk/bike around your cities, hear what planners want, and use your ideas to make the world a better place!