
A couple of months ago, I had posted about the Bombay Real time Air quality Sensing (BRAS) project, which is using a Development Impact Lab (DIL) Explore grant to set up an air quality monitoring network in Bombay.
Thanks to some great work by Shubham Jain, we now have the SDB timeseries stack (Giles -> UPMU plotter -> BtrDB) installed and displaying historical air quality data from 9 locations in Bombay. The Dylos devices that we have sent over are still being calibrated, so these are the readings from the official network set up by the Indian Government (SAFAR). The readings are from the really expensive BAM monitors, so we are considering using them as ground truth for field calibration of Dylos sensors.
The official SAFAR website does not offer historical readings, but our server makes it possible to track and perform analysis on long-term trends.
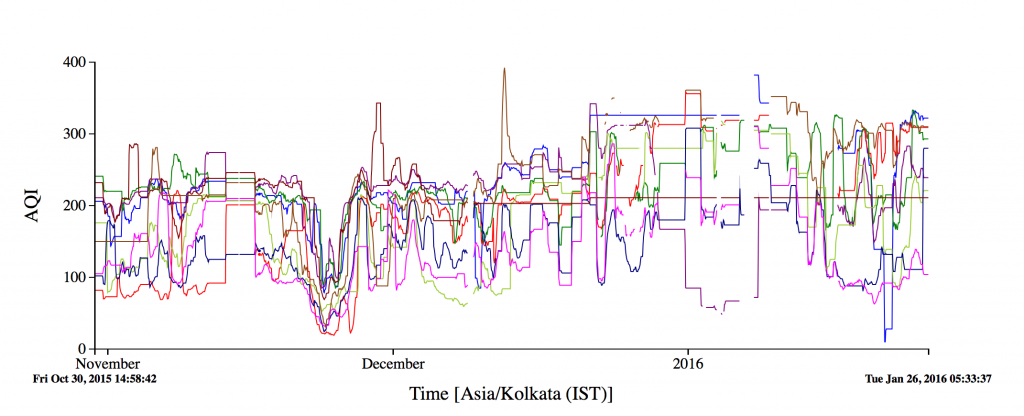
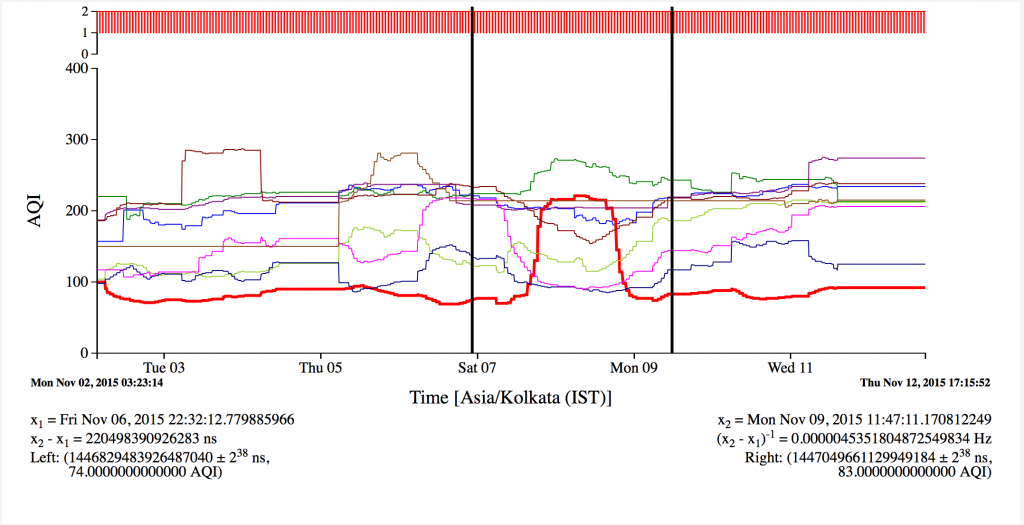
Although we have only been reading their streams for the past few months, we can already see some big spikes. Some of the spikes can be explained – the spike in almost every stream on Wed, 11th Nov was probably due to Diwali – while some of them, like the giant spike in the BKC stream on the night of Sat, 7th Nov or the one in the Mazagaon stream on 28th Nov, or the one in the Bhandup stream on 17th Jan, have no current explanation.
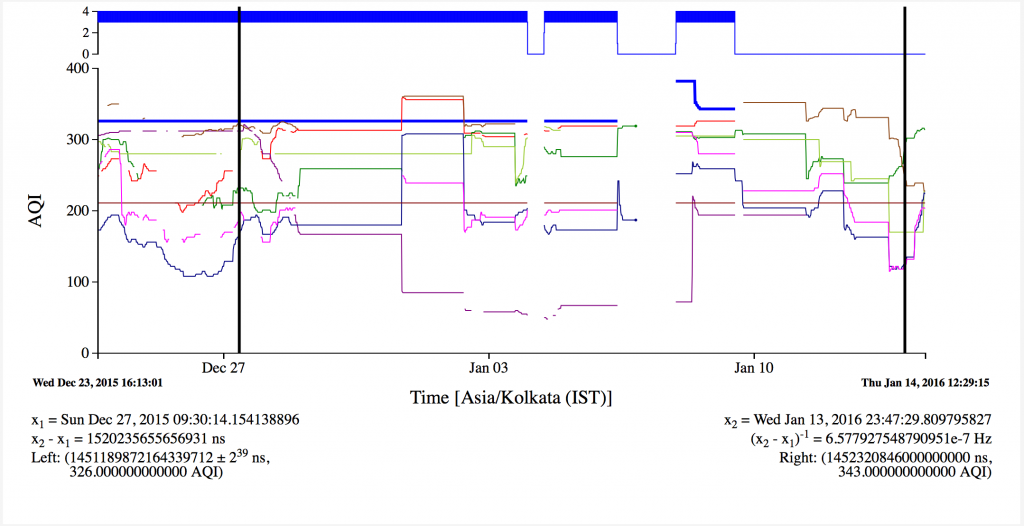
We also notice that the streams appear to be periodically turned off, for example, from the night of Wed, 11th Nov to the night of Tuesday, 17th Nov. During that time, Shubham verified that there was no error with the script, the SAFAR server was in fact reporting the exact same value for that entire period. We see similar gaps around the New Year (27th Dec to 10th Jan).
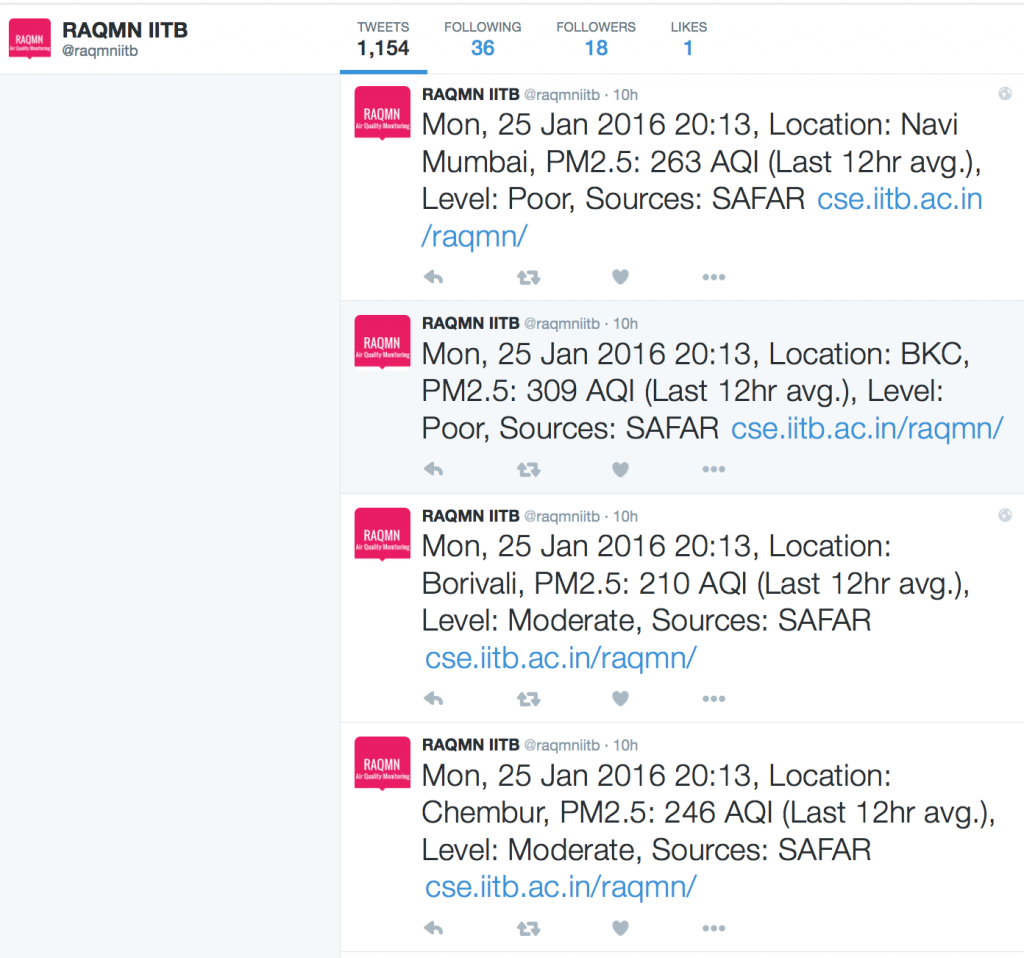
Shubham has also hooked these streams up to twitter, similar to the US embassy twitter feed in Beijing. The feed reports both the raw value, and the AQI value as per the Indian AQI standards developed by the Indian Central Pollution Control Board (CPCB). As we can see, the air quality in all areas of Bombay has consistently ranged between Poor and Very Poor. Please consider subscribing to the feed and also sharing it with your friends and family. It would be great to get followers from Bombay since they are the ones who are most directly affected. I would also like to put in a plug for the official SAFAR mobile app (android) which provides both current readings, and predictions for the air quality in upcoming days.
Finally, Shubham has made the data that we have collected available through a REST API. This basically opens up the SAFAR data and makes it available for use by the general community.
Shubham is now focusing on calibrating the low cost Dylos monitors that we sent over. We propose to perform the initial calibration in a controlled setting under the guidance of Prof. Virendra Sethi from the IIT Bombay Environmental Engineering Department. Depending on what Prof. Sethi recommends, we may deploy the units at the same locations at the SAFAR units so that we can compare against the readings from the more expensive machines.
Finally, once we have determined the error parameters, we will do an initial deployment at IIT Bombay, and begin contacting colleges in Bombay to see which of them would like to join the air quality monitoring revolution. Stay tuned for further details…
This work was supported by the Development Impact Lab at UC Berkeley (USAID Cooperative Agreement AID-OAA-A-13-00002 and AID-OAA-A-12-00011), part of USAID’s Higher Education Solutions Network.