AMP BLAB: The AMPLab Blog

Silicon Valley is Migrating North

Patterson

Everyone knows that many entrepreneurs went to Stanford, but few know that UC Berkeley alumni are just as entrepreneurial.

For example, many would be surprised to learn that most startups are now locating much closer to Berkeley than they are to Palo Alto. A recent article in the New York Times listed the top 50 startups worldwide likely to become the next “unicorns” (billion dollar evaluation). Impressively, not only are half of them in the Bay Area, a third are in San Francisco by itself. (The rest: New York City 8, China 4, E.U. 3, Boston 2, Chicago 2, India 2, Southern California 2, Arlington 1, and Cape Town 1.)

I thought these potential unicorns might predict where future successful startups will locate, so to see where Silicon Valley is headed, I mapped the 25 Bay Area startups and their geographic center. It looks like the next heart of Silicon Valley is San Francisco. Histories of creating regions like Silicon Valley have often pointed to the critical role of great universities. So what great technology research university is closest to San Francisco? UC Berkeley, which is just a 20-minute BART trip away.

Potential unicorns in Bay Area according to NY Times

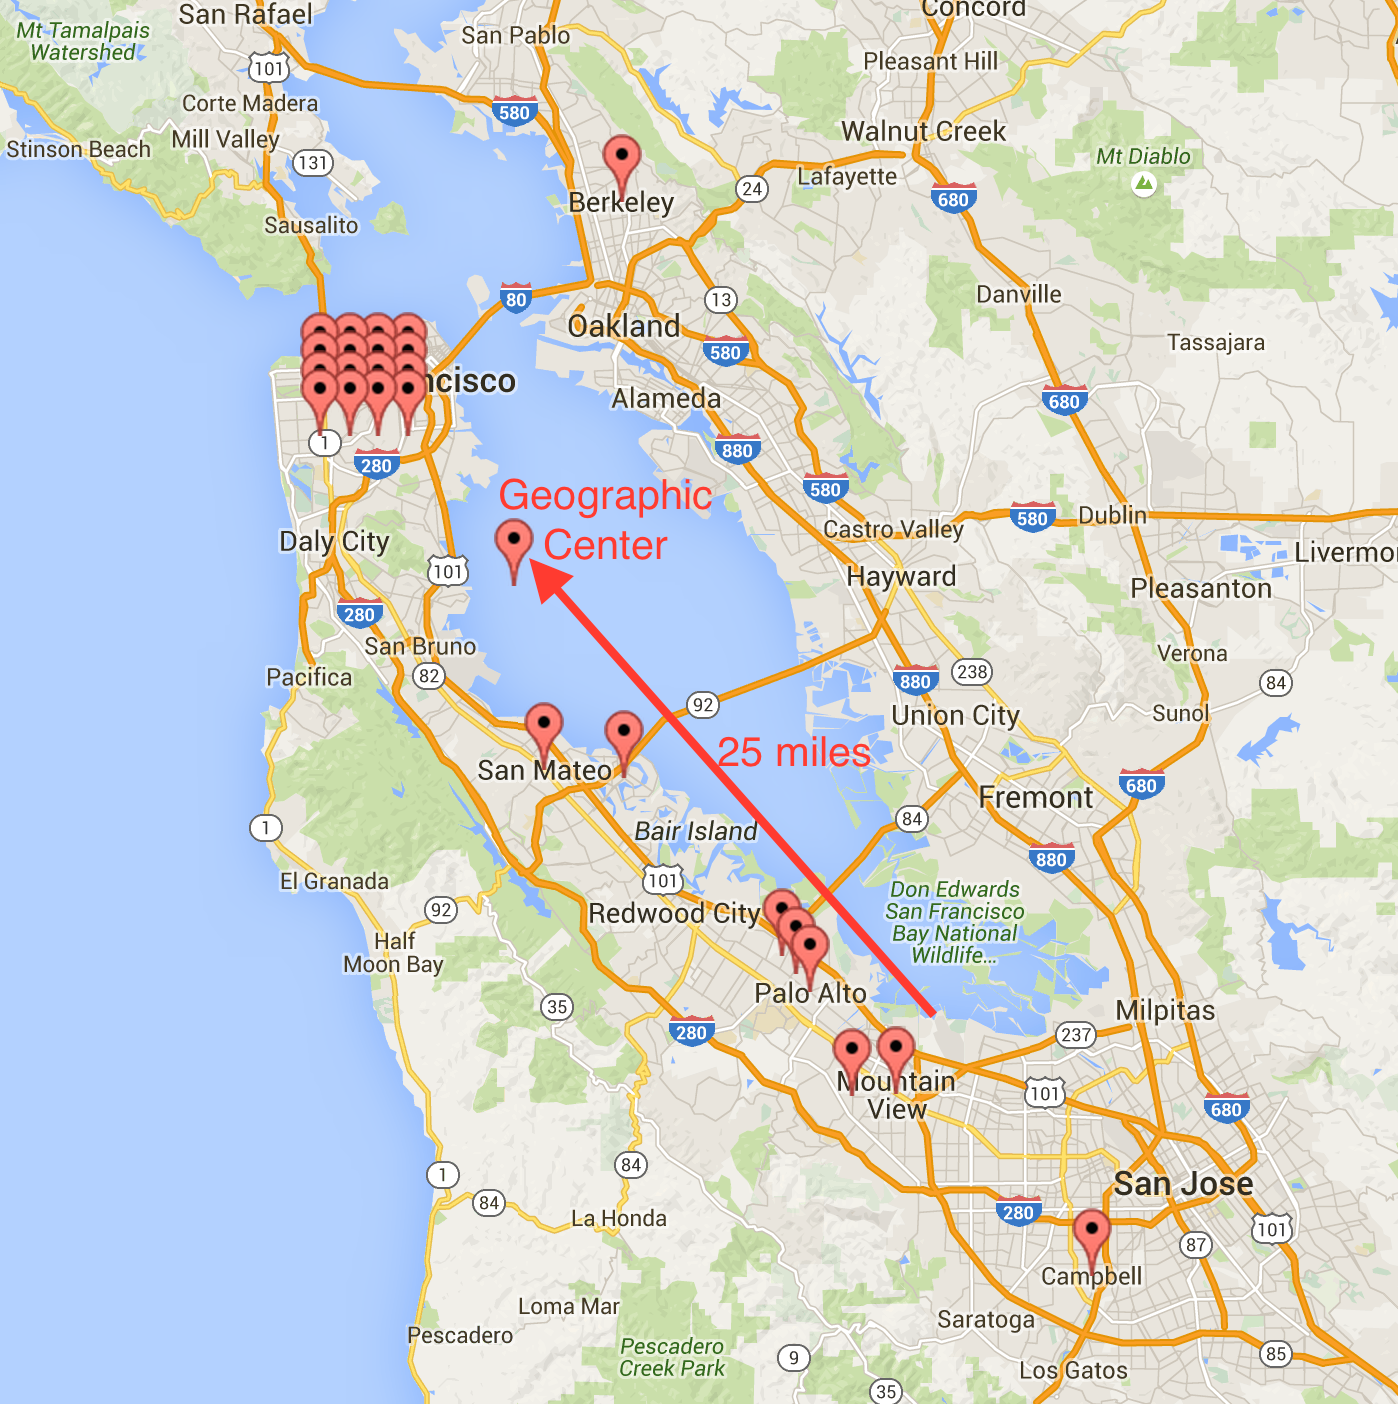
Location of 25 promising startups in the San Francisco Bay Area according to 8/23/15 NY Times

The BerkeleyX XSeries on Big Data is Complete!

Anthony

This is a follow up post to our earlier posts about two freely available Massive Open Online Courses (MOOCs) we offered this summer as part of the BerkeleyX Big Data XSeries. The courses were the result of a collaboration between professors Anthony D. Joseph (UC Berkeley) and Ameet Talwalkar (UCLA) with generous sponsorship by Databricks. We are pleased to report that we have completed the first successful runs of both courses, with highly positive student feedback along with enrollment, engagement, and completion rates that are two to five times the averages for MOOCs.

The first course, CS100.1x Introduction to Big Data with Apache Spark, introduced nearly 76,000 students to data science concepts and showed them how to use Spark to perform large-scale analyses through hands-on programming exercises with real-world datasets. Over 35% of the students were active in the course and the course completion rate was 11%. As an alternative to Honor Code completion certificates, we offered a $50 ID Verified Certificate option and more than 4% of the students chose this option. Over 83% of students enrolled in the Verified Certificate option completed the course.

The second course, CS190.1x Scalable Machine Learning, leveraged Spark to introduce students to the underlying statistical and algorithmic principles required to develop scalable machine learning pipelines. This course also had notably high enrollment (50K), completion rate (15%), percentage of Verified Certificate students (6%), and completion rate for verified students (88%). Overall, 1,800 students earned verified certificates for both courses and received a BerkeleyX Big Data XSeries Certificate.  

Stay tuned for announcements about future runs of these and follow-up MOOCs!

Getting a dozen 20 year olds to work together for fun and … social good

Shankari

In Spring 2015, we ran an experimental course that explored the intersection of three trends related to the AMPLab mission and its role in educating students at the world’s best public university.

First, as the boundaries of computing grow, the scale and complexity of the problems that we tackle grows. This means that most impactful work is done collaboratively, and as we have seen in the AMPLab, across previously separate disciplines.

Second, as David Patterson pointed out in his NYT OpEd, there is need for long-term and sustained system building to tackle large-scale social problems that goes beyond one night hackathons.

Third, as David Corman from the NSF pointed out in his keynote at PerCom 2015, many students are now entering EECS departments with significant prior programming expertise, and we need to develop instructional techniques that can build on that base while challenging them and deepening their understanding.

In our course, we attempted to address all these issues by scaling up the”undergraduate assistant” concept 10 fold. We ran a small (~11 people) undergraduate research seminar that allowed students with skills across a variety of disciplines to work in small groups on various aspects of our e-mission research project.

In contrast to other undergraduate project classes, the students worked on three aspects of a single large-scale system, and the goal was to build a real, end to end system rather than a prototype.

The Center for Information Technology Research in the Interest of Society (CITRIS) ran a nice story on the class this week.
http://citris-uc.org/one-ph-d-students-mission-to-reduce-our-carbon-footprint/

Did it work? In many ways, yes. The exercise of preparing for the class – planning a syllabus, making the code ready for others to contribute, turning on automated tests – was a forcing function to help clarify the focus of the project. The students liked the class (rating: 6.6/7) and felt that it was useful (rating: 6.2/7). We built a system that works together end to end and generates results.

But it was definitely not perfect. The end to end system is startup/prototype quality. It is good enough to play around with possibilities, but it is not yet good enough to use for a real world evaluation.

The two biggest challenges were a reflection of those faced in any team setting, but magnified by the differences between the academic and industry environments.

First, this was just one class on students’ packed schedules and they had to prioritize it accordingly. But that made coordinating dependencies between components tricky – if students A and B were responsible for modules A and B, and B depended on A, but student A had a midterm one week, she was not going to work on module A until it was done. And by the time she could get to module A, it might be midterm time for student B.

Second, we had a strong Lake Woebegon effect – everybody needed to get an A. In a normal class setting, having some students turn in B or C level work does not affect others. But here, a student who tried to use B or C level work had to spend time cleaning it up before she could use it, which lead to resentment. This is true of all project classes, but was amplified here because all project teams were working on a single system.

Added in were a steep learning curve, different skill levels across the interdisciplinary teams, and a “testing takes too much time” attitude. We had to spend significant time and effort as the “glue” – establishing an overall framework structure, integrating all the disparate pieces at the end and forcing the development of at least minimal test cases.

If we were to do it again, it would be interesting to structure it as a year long course. That would help with the learning curve, and give us another semester to make the system robust and conduct a comprehensive evaluation. We would also plan for building more of the framework ourselves in order to reduce dependencies between students. It is an interesting pedagogical challenge to figure out how to do this while still giving students the experience of building something large and complex.

When might that happen? Not this Fall, for sure. How about next Spring or later? Only time will tell… :)

Announcing Splash: Efficient Stochastic Learning on Clusters

yuczhang

We are happy to announce Splash: a general framework for parallelizing stochastic learning algorithms on multi-node clusters. If you are not familiar with stochastic learning algorithms, don’t worry! Here is a brief introduction to their central role in machine learning and big data analytics.

What is a Stochastic Learning Algorithm?

Stochastic learning algorithms are a broad family of algorithms that process a large dataset by sequential processing of random subsamples of the dataset. Since their per-iteration computation cost is independent of the overall size of the dataset, stochastic algorithms can be very efficient in the analysis of large-scale data. Examples of stochastic algorithms include:

Stochastic learning algorithms are generally defined as sequential procedures and as such they can be difficult to parallelize. To develop useful distributed implementations of these algorithms, there are three questions to ask:

  • How to speed up a sequential stochastic algorithm via parallel updates?
  • How to minimize the communication cost between nodes?
  • How to design a user-friendly programming interface for Spark users?

Splash addresses all three of these issues.

What is Splash?

Splash consists of a programming interface and an execution engine. You can develop any stochastic algorithm using the programming interface without considering the underlying distributed computing environment. The only requirement is that the base algorithm must be capable of processing weighted samples. The parallelization is taken care of by the execution engine and is communication efficient. Splash is built on Apache Spark, so that you can employ it to process Resilient Distributed Datasets (RDD).

On large-scale datasets, Splash can be substantially faster than existing data analytics packages built on Apache Spark. For example, to fit a 10-class logistic regression model on the mnist8m dataset, stochastic gradient descent (SGD) implemented with Splash is 25x faster than MLlib’s L-BFGS and 75x faster than MLlib’s mini-batch SGD for achieving the same accuracy. All algorithms run on a 64-core cluster.

To learn more about Splash, visit the Splash website or read our paper. You may also be interested in the Machine Learning Packages implemented on top of Splash. We appreciate any and all feedback from early users!

splash-adagrad-plot

Announcing SparkR: R on Spark

shivaram
I am excited to announce that the upcoming Apache Spark 1.4 release will include SparkR, an R package that allows data scientists to analyze large datasets and interactively run jobs on them from the R shell.R is a popular statistical programming language with a number of extensions that support data processing and machine learning tasks. However, interactive data analysis in R is usually limited as the runtime is single-threaded and can only process data sets that fit in a single machine’s memory.  SparkR, an R package initially developed at the AMPLab, provides an R frontend to Apache Spark and using Spark’s distributed computation engine allows us to run large scale data analysis from the R shell.

Project History

The SparkR project was initially started in the AMPLab as an effort to explore different techniques to integrate the usability of R with the scalability of Spark. Based on these efforts, an initial developer preview of SparkR was first open sourced in January 2014. The project was then developed in the AMPLab for the next year and we made many performance and usability improvements through open source contributions to SparkR. SparkR was recently merged into the Apache Spark project and will be released as an alpha component of Apache Spark in the 1.4 release.

SparkR DataFrames

The central component in the SparkR 1.4 release is the SparkR DataFrame, a distributed data frame implemented on top of Spark.  Data frames are a fundamental data structure used for data processing in R and the concept of data frames has been extended to other languages with libraries like Pandas etc. Projects like dplyr have further simplified expressing complex data manipulation tasks on data frames. SparkR DataFrames present an API similar to dplyr and local R data frames but can scale to large data sets using support for distributed computation in Spark.

The following example shows some of the aspects of the DataFrame API in SparkR. (You can see the full example at https://gist.github.com/shivaram/d0cd4aa5c4381edd6f85)

# flights is a SparkR data frame. We can first print the column 
# names, types 
flights
#DataFrame[year:string, month:string, day:string, dep_time:string, dep_delay:string, #arr_time:string, arr_delay:string,...

# Print the first few rows using `head`
head(flights)

# Filter all the flights leaving from JFK
jfk_flights <- filter(flights, flights$origin == "JFK")

# Collect the DataFrame into a local R data frame (for plotting etc.)
local_df <- collect(jfk_flights)

For a more comprehensive introduction to DataFrames you can see the SparkR programming guide at http://people.apache.org/~pwendell/spark-releases/latest/sparkr.html

Benefits of Spark integration

In addition to having an easy to use API, SparkR inherits many benefits from being tightly integrated with Spark. These include:

Data Sources API: By tying into Spark SQL’s data sources API SparkR can read in data from a variety of sources include Hive tables, JSON files, Parquet files etc.

Data Frame Optimizations: SparkR DataFrames also inherit all of the optimizations made to the computation engine in terms of code generation, memory management. For example, the following chart compares the runtime performance of running group-by aggregation on 10 million integer pairs on a single machine in R, Python and Scala (using the same dataset as https://goo.gl/iMLXnh). From the graph we can see that using the optimizations in the computation engine makes SparkR performance similar to that of Scala / Python.

Screen Shot 2015-06-08 at 7.11.27 PM

Scalability to many cores and machines: Operations executed on SparkR DataFrames get automatically distributed across all the cores and machines available on the Spark cluster. As a result SparkR DataFrames can be used on terabytes of data and run on clusters with thousands of machines.

Looking forward

We have many other features planned for SparkR in upcoming releases: these include support for high level machine learning algorithms and making SparkR DataFrames a stable component of Spark.

The SparkR package represents the work of many contributors from various organizations including AMPLab, Databricks, Alteryx and Intel. We’d like to thank our contributors and users who tried out early versions of SparkR and provided feedback.  If you are interested in SparkR, do check out our talks at the upcoming Spark Summit 2015.


BerkeleyX Data Science on Apache Spark MOOC starts today

Anthony

For the past several months, we have been working to produce two freely available Massive Open Online Courses (MOOCs). We are proud to announce that both MOOCs are launching this month on the BerkeleyX platform!

Today we launched the first course, CS100.1x, Introduction to Big Data with Apache Spark, a brand new five-week long course on Big Data, Data Science, and Apache Spark with nearly 57,000 students (UC Berkeley’s 2014 enrollment was 37,581 students).

The first course eaches students about Apache Spark and performing data analysis. The course assignments include Log Mining, Textual Entity Recognition, and Collaborative Filtering exercises that use real-world data to teach students how to manipulate datasets using parallel processing with PySpark.

The second course, called Scalable Machine Learning, will begin on June 29th and will introduce the underlying statistical and algorithmic principles required to develop scalable machine learning pipelines, and provides hands-on experience using Spark.

We would also like to thank the Spark community for their support.  Several community members are serving as teaching assistants and beta testers, and multiple study groups have been organized by community members in anticipation of these courses.

Both courses are available for free on the edX website, and you can sign up for them today:

  1. Introduction to Big Data with Apache Spark
  2. Scalable Machine Learning

For students who complete a course, the courses offer the choice of free Honor Code completion certificates or paid edX IDVerified Certificates

The courses are sponsored in part by the AMPLab and Databricks.

Announcing KeystoneML

sparks

We’ve written about machine learning pipelines in this space in the past. At the AMPLab Retreat this week, we released (live, on stage!) KeystoneML, a software framework designed to simplify the construction of large scale, end-to-end, machine learning pipelines in Apache Spark. KeystoneML is alpha software, but we’re releasing it now to get feedback from users and to collect more use cases.

Included in the package is a type-safe API for building robust pipelines and example operators used to construct them in the domains of natural language processing, computer vision, and speech. Additionally, we’ve included and linked to several scalable and robust statistical operators and machine learning algorithms which can be reused by many workflows.

Also included in the code are several example pipelines that demonstrate how to use the software to reproduce recent academic results in computer vision, natural language processing, and speech processing. Here’s an example:

Sample SIFT and Fisher Vector based Image Classification pipeline, included in KeystoneML.

Sample SIFT and Fisher Vector based Image Classification pipeline, included in KeystoneML.

This pipeline for image classification reproduces a recent academic result in image classification from Chatfield, et. al. when applied to the “VOC 2007” dataset, and is automatically distributed to run on a cluster.

Users familiar with the new spark.ml package may recognize several similarities in the API concepts and interfaces presented between these two projects. This is no coincidence since we contributed to the design and initial implementation of spark.ml. However, KeystoneML provides both a richer set of built-in operators – for example, image featurizers and large-scale linear solvers – and modifies the spark.ml interface to provide type-safety and ensure further robustness.

To try out KeystoneML, head over the the project home page and check out the quick start and programming guides, and check out the code on GitHub. We’d love to hear feedback from early users — please feel free to join the mailing list.

Intel Shanghai presents: AMPCamp China!

Shane Knapp

Our friends at Intel Shanghai are helping to spread the word about Spark!

AmpCamp@China 2015 will be held on May 23 2015 at Intel’s Zizhu Campus in Shanghai.

UC Berkeley AMPLab is not only a world leading research lab in big data and analytics, but have also produced BDAS (Berkeley Data Analytics Stack), an open source, next-generation data analytics stack that has wide adoption in both industry and research. Intel and AMPLab have long and close collaborations, especially on the open source development of many projects in BDAS (such as Spark, Shark, Tachyon, SparkR, GraphX, MLlib, etc.).

AMP CampChina LOGOv3This is the first time an AMP Camp will take place abroad! Between 2010 and 2014, Berkeley AMPLab successfully held five Amp Camp events in the States; the last event (AMPCamp 5) had over 200 people on-site and over 1800 views of the live stream from over 40 countries. This year, Intel Shanghai is collaborating with AMPLab to present this hugely successful event to the big data industry, developer community and academia in China.

The collaboration with UC Berkeley AMPLab is a part of Intel’s larger open source efforts in big data and analytics. For years, Intel has been playing a key role in many open source big data projects (e.g., Hadoop, Spark, HBase, Tachyon, etc.), collaborating with the academia to apply advanced big data research to real-world problems, and partnering with the industry and community to build web-scale data analytics systems.

Come and join AmpCamp@China 2015 to hear about the cutting edge components of BDAS, meet the world-class big data engineers (including Apache project committers and PMC members) at Intel’s Zizhu Campus in Shanghai, and get a sneak peek of the latest research progress from AMP Lab researchers.

For more information, please visit the Intel Shanghai AMPCamp page.

The exercises and course work from AMPCamp 5 will be used at this event, and are found here.

Moore’s Law B. 1965, D. 2015

Patterson

Gordon Moore (Berkeley class of 1959) made the most incredible technology observation* on April 19, 1965 when he suggested that the number of transistors per integrated circuit would double every year, so that by 1975 there could be 65,000 transistors on a single chip when there were only 64 in 1965. It’s a bold prediction of exponential growth. ( See related article in Barrons ).

Here is his second paragraph on the consequences of such growth:

“Integrated circuits will lead to such wonders as home computers—or at least terminals connected to a central computer—automatic controls for automobiles, and personal portable communications equipment. The electronic wristwatch needs only a display to be feasible today.”

Moore’s Law lasted for half a century and changed the world as Moore predicted in his 1965 article, but it has ended. Chip technology is still improving, but not at the exponential rate predicted by Moore’s Law. In fact, each generation is taking longer than the previous one. For example, the biggest Intel microprocessor in 2011 used 2.3 billion transistors, and 4 years later the largest one is “only” 5.5 billion transistors. It’s still an amazing technology, and it will continue to improve, but not at the breathtaking rate of the past 50 years.

In 2003 Gordon Moore said

“No exponential is forever … but we can delay ‘forever’.”

Looks like forever was delayed another decade, but no more.

*Gordon E. Moore, “Cramming More Components onto Integrated Circuits,” Electronics, pp. 114–117, April 19, 1965.