AMP BLAB: The AMPLab Blog

Introducing AMPCrowd: a simple service for declarative cross-crowd microtasking.

Daniel Haas

Crowdsourcing platforms like Amazon’s Mechanical Turk (AMT) make it possible to assign human workers small ‘microtasks’, such as labeling images or detecting duplicate products, in order to apply the power of human intellect at scale to problems that cannot be fully automated. These platforms often provide programmatic interfaces for microtask management upon which those of us researching the ‘P’ in ‘AMP’ rely heavily. Unfortunately, using those APIs to manage the lifecycle of human computation tasks can be a real hassle. For example, a standard workflow when using a crowd platform like AMT to detect duplicate products involves:

  • Designing a task interface in HTML, Javascript and CSS to allow users to select pairs of products that are identical.
  • Implementing and hosting a web service (with ssl support) to present the task interface to workers on the AMT website.
  • Using the AMT API to create a batch of new tasks and to send each task to multiple workers to ensure high quality results.
  • Using the AMT API to fetch results when the batch has been processed by the workers.
  • Writing custom code to merge the responses of multiple workers for the same task (either simple majority voting, or more sophisticated quality control).
  • Storing the results in a database for future access.

Though much of the code supporting this workflow can theoretically be reused in subsequent crowd-based projects, it seldom turns out that way in practice. In response, we’re releasing AMPCrowd: an extensible web service with a simple RESTful API for managing the crowd task lifecycle. AMPCrowd makes it easy to run crowd tasks on existing platforms, is extensible to new types of microtasks and new crowd platforms, and provides state-of-the-art quality control techniques with no user effort.

Using AMPCrowd, the workflow described above can be accomplished with a single declarative API call to create a new batch of tasks. The user specifies the type of the tasks (e.g. ‘duplicate detection’), the number of distinct worker responses to get for each task, the crowd platform on which to process the tasks (current options are AMT and a local interface for in-house workers), and a JSON dictionary with the data needed to render each task (e.g. the pairs of products to consider). AMPCrowd transparently handles the work of sending tasks to the selected crowd platform, fetching results as workers complete them, and running quality control algorithms to improve the resulting output. Those looking to get results in real-time can pass in a callback URL to receive push notifications as workers finish each individual task. Otherwise, the results are available in AMPCrowd’s PostgreSQL database.

AMPCrowd’s modular design makes it easy to add both new task types and support for new crowd platforms. Adding a new task type is as simple as writing the HTML to display a single task. Adding support for a new crowd platform is a bit more involved, but can be done by implementing a common interface for creating and managing tasks in a standalone Django app–no need to modify existing code.

AMPCrowd is implemented in python using the Django web framework, and a recent contribution from one of our collaborators (thanks @EntilZhaPR at Trulia!) provides Docker support, so the code can be deployed with a single command. Check out the repository at https://github.com/amplab/ampcrowd, or read our (sparse but growing) documentation at http://amplab.github.io/ampcrowd/.

Big data meets… crapcan racing?

Shane Knapp

They say all work and no play makes Jack a dull boy…  And here at the AMPLab, we do occasionally take a break from our day jobs and have some fun.  For instance, when I’m not obsessing over our build system, I obsess over cars.  Not only do I have a massive toolbox on wheels with a wrench for every occasion, I also provide racetrack instruction and am building a car that will soon be competing in NASA Time Trial events.

Over the last several years, as described in this article, racing cars has become a popular pastime among the Silicon Valley tech crowd.  I discovered track events and racing almost seven years ago, but instead of the high-powered board room meeting track events, I specialize in my own special kind of grassroots obsession.  An obsession that somehow combines cars, racing, data and open source.

IMG_20150320_170552~2

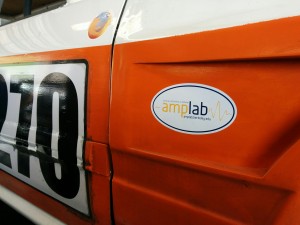
Our “corporate” sponsor, meaning part of my paycheck goes to my share of team expenses.

It’s endurance racing…  And not just any kind of endurance racing, but crapcan racing for $500 cars in The 24 Hours of Lemons.  The idea behind Lemons is to keep costs down and make endurance racing something that anyone with the desire to do it an attainable and (mostly) affordable hobby.  Started in 2007, the series has grown from one race in California to being a national series with over 40 races per year.

It’s important to note that the $500 limit applies only to the car, and you can sell off things like the interior to bring the total spent to $500…  Got some nice OEM seats?  A decent interior?  Strip it out and sell it!  Safety equipment, on the other hand, like the racing seat and cage doesn’t count towards the total.  Neither do brakes, wheels, tires and “driver comfort” items (fancy steering wheel, driver cooling and hydration systems, etc).  All in all, a decent build will cost roughly $5000-$8000 when all is said and done.  To put this in perspective, this is less than a THIRD of the cost of a competitive and race-prepped Spec Miata, and that figure skyrockets if you want to race something like a Porsche.

Some action on the track. Source: Car & Driver Magazine

The fields are huge (180+ cars racing at once) and the variety of vehicles is staggering (including a 1961 Rambler American, lots of BMW E30s, various 1980s econoboxes, and the occasional Geo Metro powered by a rear-mounted Honda CBR motorcycle engine).  Theme is important, and some of these cars would make excellent Burning Man art cars.  You can read more about some of the crazier builds here…  It’s amazing what people put on the track, and how well some of them do.  Watching the race itself is a spectacle.

With cars like this, built by teams in their backyards, or even in fully stocked professional race shops, things are bound to go south.  In fact, this is so common, and teams scramble and help each other rebuilding and swapping engines overnight hoping to get back in to the race, that there’s even an award for this:  The Heroic Fix.  Some other awards are the “Index of Effluency”, “Organizers Choice”, “We Don’t Hate You, You Just Suck”, as well as the smallest (physical sized) trophies for the overall winners in the three classes (A, B and C, extremely loose categories based on the descending chance of either winning overall or just finishing the race).  It’s all a bit tongue-in-cheek, and meant to keep things from getting too serious.  All of us out there want to have fun, but without being overly competitive.  Cheating is expected, and bribes for the judges (usually booze) are plentiful. The grassroots community is amazing, and it’s the reason Lemons is so successful.

But, even though it’s friendly, the races are extraordinarily competitive.  The top teams use every trick possible to get an edge.  We, like many other teams, use data.


IMG_20150320_125954~3

Your couch won’t fit, but it sure does move.

My team, Captained by Chris More, runs a 1991 Mazda RX-7.  Our car is themed as a U-Haul truck, and the twist echoes the common sentiment that many people have when renting a nearly broken down box truck or sketchy trailer for a move:  FU-Haul

Unlike some of the junkers on the track, we’ve spent a lot of time making the car fast, reliable and competitive.  That being said, over the course of a race (usually 16 hours, split over two days), things that one wouldn’t expect to fail do, and sometimes in spectacular fashion.  In our most recent race (Sears Pointless, March 20-21 2015 at Sonoma Raceway), our transmission decided to spray it’s vital juices up through the gear shift gate and cover the entire interior of the car (including the driver) with a coating of smelly transmission fluid.  Our front brake rotors were extremely warped as well, and under heavy braking (the best kind), the steering wheel would jerk from side to side and almost be ripped from our grasp.  Not to mention the severe fuel cutoff issues when we were below half a tank of gas…  Thankfully, we were able to hold it together and finish the race.  We placed 11th out of 181 entries, nearly cracking the top 10!

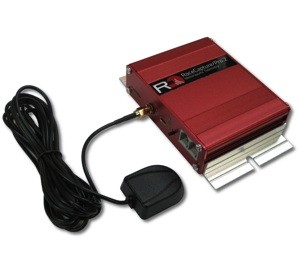
This is some seriously cool hardware!

This is some seriously cool open source hardware!

But what does this have to do with big data and open source?

The four team members are all involved in high tech, consisting of Mozilla, Level 3 and Google alums.  We are all about open source, and love data…  And we collect in-car telemetry data with an open source hard- and software product from Autosport Labs called Race Capture Pro.

While we don’t use Spark for data processing (go go Google Sheets!), the data we collect is invaluable for helping us keep track of how the car and drivers perform during the race, as well as post-race bragging rights for who turned the fastest average lap (sadly, it wasn’t me).  With this data we were able to analyze things like our average pit stop time (~5 minutes, 30 seconds over 6 stops), each driver’s average lap time in traffic (Chris is the best), and with an open track (all four of us were within .6 seconds average over the entire weekend when turning fast laps, which is kind of amazing).

These metrics show that everyone except for Chris needs to improve their race traffic management skills, and that we need to bring our pit stop times down to at least 5 minutes to contend for a top-5 finish.  Our lap times are consistent and competitive, proven with data, and we know that the drivers and car are capable of more.

For a taste of how cool this data and product is, check out our statistics from the race.

For some fun reading, here’s a preview of the most recent race, and then coverage of the results.

And finally, here is some on-track action during my two hour long stint on the first day of racing…  Enjoy the wonderful sound of a rotary engine spinning up to nearly 9000rpm!


When Data Cleaning Meets Crowdsourcing

jnwang

The vision of AMPLab is to integrate Algorithms (Machine Learning), Machines (Cloud Computing), and People (Crowdsourcing) together to make sense of Big Data. In the past several years, AMPLab has developed a variety of open source software components to fulfill this vision. For example, to integrate Algorithms and Machines, AMPLab is developing MLbase, a distributed machine learning system that aims to provide a declarative way to specify Machine Learning tasks.

One area we see great potential for adding People to the mix is Data Cleaning. Real-world data is often dirty (inconsistent, inaccurate, missing, etc.). Data analysts can spend over half of their time to clean data without doing any actual analysis. On the other hand, without data cleaning it is hard to obtain high-quality answers from dirty data. Crowdsourced data-cleaning systems could help analysts clean data more efficiently and more cheaply, which would significantly reduce the cost of the entire data analysis pipeline.

Table 1: An Example of Dirty Data (with format error, missing values, and duplicate values)

figure

In this post, I will highlight two AMPLab research projects aimed in this direction: (1) CrowdER, a hybrid human-machine entity resolution system; (2) SampleClean, a sample-and-clean framework for fast and accurate query processing on dirty data.

crowder
Entity resolution (ER) in database systems is the task of finding different records that refer to the same entity. ER is particularly important when integrating data from multiple sources. In such scenarios, it is not uncommon for records that are not exactly identical to refer to the same real-world entity. For example, consider the dirty data shown in Table 1. Records r1 and r3 in the table have different text in the City Name field, but refer to the same city.

A simple method to find such duplicate records is to ask the crowd to check all possible pairs and decide whether each item in the pair refers to the same entity or not. If a data set has n records, this human-only approach requires the crowd to examine O(n^2) pairs, which is infeasible for data sets of even moderate size. Therefore, in CrowdER we propose a hybrid human-machine approach. The intuition is that among O(n^2) pairs of records, the vast majority of pairs will be very dissimilar. Such pairs can be easily pruned using a machine-based technique. The crowd can then be brought in to examine the remaining pairs.

Of course, in practice there are many challenges that need to be addressed. For example, (i) how can we develop fast machine-based techniques for pruning dissimilar pairs; (ii) how can we reduce the crowd cost that is required to examine the remaining pairs? For the first challenge, we devise efficient similarity-join algorithms, which can prune dissimilar pairs from a trillion of pairs within a few minutes; For the second challenge, we identify the importance of exploiting transitivity to reduce the crowd cost and present a new framework for implementing this technique.

We evaluated CrowdER on several real-world datasets, where they are hard for machine-based ER techniques. Experimental results showed that CrowdER achieved more than 50% higher quality than these machine-based techniques, and at the same time, it was several orders of magnitude cheaper and faster than human-only approaches.

sampleclean
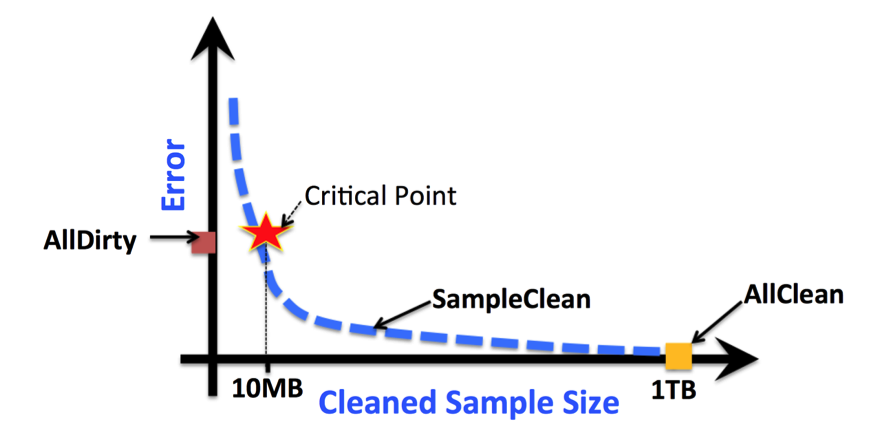
While crowdsourcing can make data cleaning more tractable, it is still highly inefficient for large datasets. To overcome this limitation, we started the SampleClean project. The project aims to explore how to obtain accurate query results from dirty data, by only cleaning a small sample of the data. The following figure illustrates why SampleClean can achieve this goal.

trade-off

In the figure, we compare the error in the query results returned by three query processing methods.

  • AllDirty does not clean any data, and simply runs a query over the entire original data set.
  • AllClean first cleans the entire data set and then runs a query over the cleaned data.
  • SampleClean is our new query processing framework that requires cleaning only a sample of the data.

We can see that SampleClean can return a more accurate query result than AllDirty by cleaning a relatively small subset of data. This is because SampleClean can leverage the cleaned sample to reduce the impact of data error on its query result, but AllDirty does not have such a feature. We can also see that SampleClean is much faster than AllClean since it only needs to clean a small sample of the data but AllClean has to clean the entire data set.

An initial version of the SampleClean system was demonstrated recently at AMPCamp 5 [slides] [video]. We envision that the SampleClean system can add data cleaning and crowdsourcing capabilities into BDAS (the Berkeley Data Analytics Stack), and enable BDAS to become a more powerful software stack to make sense of Big Data.

summary
Crowdsourcing is a promising way to scale up the inefficient process of cleaning data in the data analysis pipeline. However, crowdsourcing brings along with it a number of significant design challenges. In this post, I introduce CrowdER and SampleClean, two AMPLab’s research projects aimed at addressing this problem. Of course, there is a wide range of other open challenges to be researched in this area. We have collected a list of recently published papers on related topics by groups around the world. Interested readers can find them at this link.

AMP Camp 5

Ameet Talwalkar
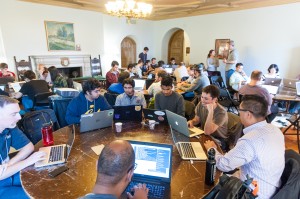
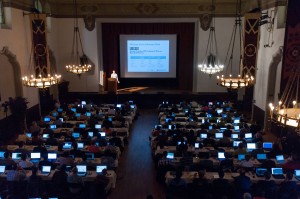
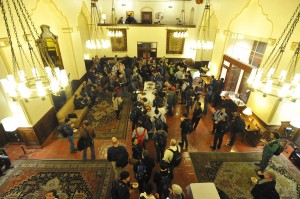
AMP Camp 5 was a huge success!  Over 200 people participated in this sold-out event, we had over 1800 views of our live stream from over 40 countries, and we received overwhelmingly positive feedback.  In addition to learning about the Berkeley Data Analytics Stack (BDAS), participants were particularly interested in interacting with many of the lead developers of the BDAS software projects, who gave talks about their work and also served as teaching assistants during the hands-on exercises.


This 2-day event provided participants with hands-on experience using BDAS, the set of open-source projects including SparkSparkSQLGraphX, and MLlib/MLbase. For the fifth installment of AMP Camp, we expanded the curriculum to include the newest open-source BDAS projects including TachyonSparkRML Pipelines and ADAM, as well as a variety of research and use-case talks.

AMP Camp 5AMP Camp 5


Details about AMP Camp 5, including slides and videos from the talks as well as all of the training material for the hands-on exercises, are available on the AMP Camp website.

AMP Camp 5
 AMP Camp 5

Aggressive Data Skipping for Querying Big Data

Liwen Sun

As data volumes continue to expand, analytics approaches that require exhaustively scanning data sets become untenable. For this reason, we have been developing data organization techniques that make it possible to avoid looking at large volumes of irrelevant data. Our work in this area, which we call “Aggressive Data Skipping”  recently got picked up by O’Reilly Radar: Data Today: Behind on Predictive Analytics, Aggressive Data Skipping + More. In this post, I give a brief overview the approach and provide references to more detailed publications.

Data skipping is an increasingly popular technique used in modern analytics databases, including IBM DB2 BLU, Vertica, Spark and many others. The idea is very simple:  big data files are partitioned into fairly small blocks of say, 10,000 rows.  For each such block we store some metadata, e.g., the min and max of each column. Before scanning each block, a query can first check the metadata and then decide if the block possibly contains records that are relevant to the query.  If the metadata indicates that no such records are contained in the block, then the block does not need to be read, i.e, it can be skipped altogether.

In our work we focus on maximizing the amount of data that can be skipped (hence the name “Aggressive Data Skipping”). The key to our approach is Workload Analysis.   That is, we observe the queries that are presented to the system over time, and then make partitioning decisions based on what is learned from those observations. Our workload-driven fine-grained partitioning framework re-orders the rows at data loading time.

In order to maximize the chance of data skipping, our research answers the following questions:

  • what partitioning method is appropriate for generating fine-grained blocks
  • what kind of (concise) metadata can we store for supporting arbitrary filters (e.g., string matching or UDF filters)

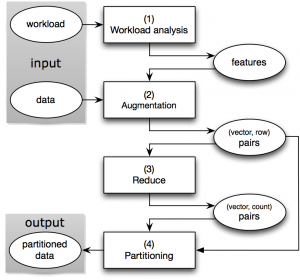
As shown in the figure below, our approach uses the following “W-A-R-P” steps:

The Partitioning Framework

  • Workload analysis: We extract the frequently recurring filter patterns, which we call the features, from the workload. The workload can be a log of past ad-hoc queries or a collection of query templates from which daily reporting queries are generated.
  • Augmentation: For each row, we compute a bit vector based on the features and augment the row with this vector.
  • Reduce: We group together the rows with the same bit vectors, since the partitioning decision will be solely based on the bit vectors rather than the actual data rows.
  • Partition: We run a clustering algorithm on the bit vectors and generate a partitioning scheme. The rows will be routed to their destination partitions guided by this partitioning scheme.

After we have partitioned the data, we store a feature bit vector for each partition as metadata. The following figure illustrates how data skipping works during query execution.

query

Data skipping during query execution

When a query comes, our system first checks which features are applicable for data skipping. With this information, the query processor then goes through the partition-level metadata (i.e., the bit vectors) and decides which partitions can be skipped. This process can work in conjunction with existing data skipping based on min/max.

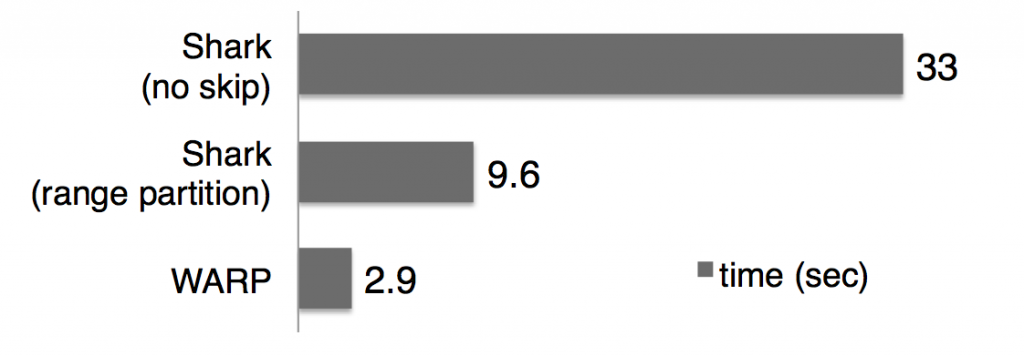
We prototyped this framework on Shark and our experiments with TPC-H and a real-world dataset show speed ups of 2x to 7x. An example result from the TPC-H benchmark (measuring average query response time over 80 TPC-H queries) is shown below.

Query Response Time

Query Response Time

For more technical details and results, please read our SIGMOD 14 paper, or if you hate formalism and equations, we also gave a demo in VLDB 14. Feel free to send an email to liwen@cs.berkeley.edu for any questions or comments on this project.

Big Data, Hype, the Media and Other Provocative Words to Put in a Title

Michael Jordan

I’ve found myself engaged with the Media recently, first in the context of a
“Ask Me Anything” (AMA) with reddit.com http://www.reddit.com/r/MachineLearning/comments/2fxi6v/ama_michael_i_jordan/ (a fun and engaging way to spend a morning), and then for an interview that has been published in the IEEE Spectrum.

That latter process was disillusioning. Well, perhaps a better way to say it is that I didn’t harbor that many illusions about science and technology journalism going in, and the process left me with even fewer.

The interview is here:  http://spectrum.ieee.org/robotics/artificial-intelligence/machinelearning-maestro-michael-jordan-on-the-delusions-of-big-data-and-other-huge-engineering-efforts

Read the title and the first paragraph and attempt to infer what’s in the body of the interview. Now go read the interview and see what you think about the choice of title.

Here’s what I think.

The title contains the phrase “The Delusions of Big Data and Other Huge Engineering Efforts”. It took me a moment to realize that this was the title that had been placed (without my knowledge) on the interview I did a couple of weeks ago. Anyway who knows me, or who’s attended any of my recent talks knows that I don’t feel that Big Data is a delusion at all; rather, it’s a transformative topic, one that is changing academia (e.g., for the first time in my 25-year career, a topic has emerged that almost everyone in academia feels is on the critical path for their sub-discipline), and is changing society (most notably, the micro-economies made possible by learning about individual preferences and then connecting suppliers and consumers directly are transformative). But most of all, from my point of view, it’s a *major engineering and mathematical challenge*, one that will not be solved by just gluing together a few existing ideas from statistics, optimization, databases and computer systems.

I.e., the whole point of my shtick for the past decade is that Big Data is a Huge Engineering Effort and that that’s no Delusion. Imagine my dismay at a title that said exactly the opposite.

The next phrase in the title is “Big Data Boondoggles”. Not my phrase, nor my thought. I don’t talk that way. Moreover, I really don’t see anything wrong with anyone gathering lots of data and trying things out, including trying out business models; quite to the contrary. It’s the only way we’ll learn. (Indeed, my bridge analogy from later in the article didn’t come out quite right: I was trying to say that historically it was crucial for humans to start to build bridges, and trains, etc, etc, before they had serious engineering principles in place; the empirical engineering effort had immediate positive effects on humans, and it eventually led to the engineering principles. My point was just that it’s high time that we realize that wrt to Big Data we’re now at the “what are the principles?” point in time. We need to recognize that poorly thought-out approaches to large-scale data analysis can be just costly as bridges falling down. E.g., think individual medical decision-making, where false positives can, and already are, leading to unnecessary surgeries and deaths.)

Next, in the first paragraph, I’m implied to say that I think that neural-based chips are “likely to prove a fool’s errand”. Not my phrase, nor my thought. I think that it’s perfectly reasonable to explore such chip-building; it’s even exciting. As I mentioned in the interview, I do think that a problem with that line of research is that they’re putting architecture before algorithms and understanding, and that’s not the way I’d personally do things, but others can beg to differ, and by all I means think that they should follow their instincts.

The interview then proceeds along, with the interviewer continually trying to get me to express black-and-white opinions about issues where the only reasonable response is “gray”, and where my overall message that Big Data is Real but that It’s a Huge Engineering Challenge Requiring Lots of New Ideas and a Few Decades of Hard Work keeps getting lost, but where I (valiantly, I hope) resist. When we got to the Singularity and quantum computing, though—areas where no one in their right mind will imagine that I’m an expert—I was despairing that the real issues I was trying to have a discourse about were not really the point of the interview and I was glad that the hour was over.

Well, at least the core of the article was actually me in my own words, and I’m sure that anyone who actually read it realized that the title was misleading (at best).

But why should an entity such as the IEEE Spectrum allow an article to be published where the title is a flat-out contradiction to what’s actually in the article?

I can tell you why: It’s because this title and this lead-in attracted an audience.

And it was precisely this issue that I alluded to in my response to the first question—i.e., that the media, even the technology media that should know better, has become a hype-creator and a hype-amplifier. (Not exactly an original thought; I know…). The interviewer bristled, saying that the problem is that academics put out press releases that are full of hype and the poor media types don’t know how to distinguish the hype from the truth. I relented a bit. And, sure, he’s right, there does seem to be a growing tendency among academics and industrial researchers to trumpet their results rather than just report them.

But I didn’t expect to become a case in point. Then I saw the title and I realized that I had indeed become a case in point. I.e., here we have a great example of exactly what I was talking about—the media willfully added some distortion and hype to a story to increase the readership. Having the title be “Michael Jordan Says Some Reasonable, But Somewhat Dry, Academic, Things About Big Data” wouldn’t have attracted any attention.

(Well “Michael Jordan” and “Big Data” would have attracted at least some attention, I’m afraid, but you get my point.)

(As for “Maestro”, usually drummers aren’t referred to as “Maestros”, so as far as that bit of hyperbole goes I’m not going to complain… :-).

Anyway, folks, let’s do our research, try to make society better, enjoy our lives and forgo the attempts to become media darlings. As for members of the media, perhaps the next time you consider adding that extra dollop of spin or hype… Please. Don’t.

Mike Jordan

ML Pipelines

sparks

Recently at the AMP Lab, we’ve been focused on building application frameworks on top of the BDAS stack. Projects like GraphX, MLlib/MLI, Shark, and BlinkDB have leveraged the lower layers of the stack to provide interactive analytics at unprecedented scale across a variety of application domains. One of the projects that we have focused on over the last several months we have been calling “ML Pipelines”, an extension of our earlier work on MLlib and is a component of MLbase.

In real-world applications – both academic and industrial – use of a machine learning algorithm is only one component of a predictive analytic workflow. Pre-processing steps and considerations about production deployment must also be taken into account. For example, in text classification, preprocessing steps like n-gram extraction, and TF-IDF feature weighting are often necessary before training of a classification model like an SVM. When it comes time to deploy the model, your system must not only know the SVM weights to apply to input features, but also how to get your raw data into the same format that the model is trained on.

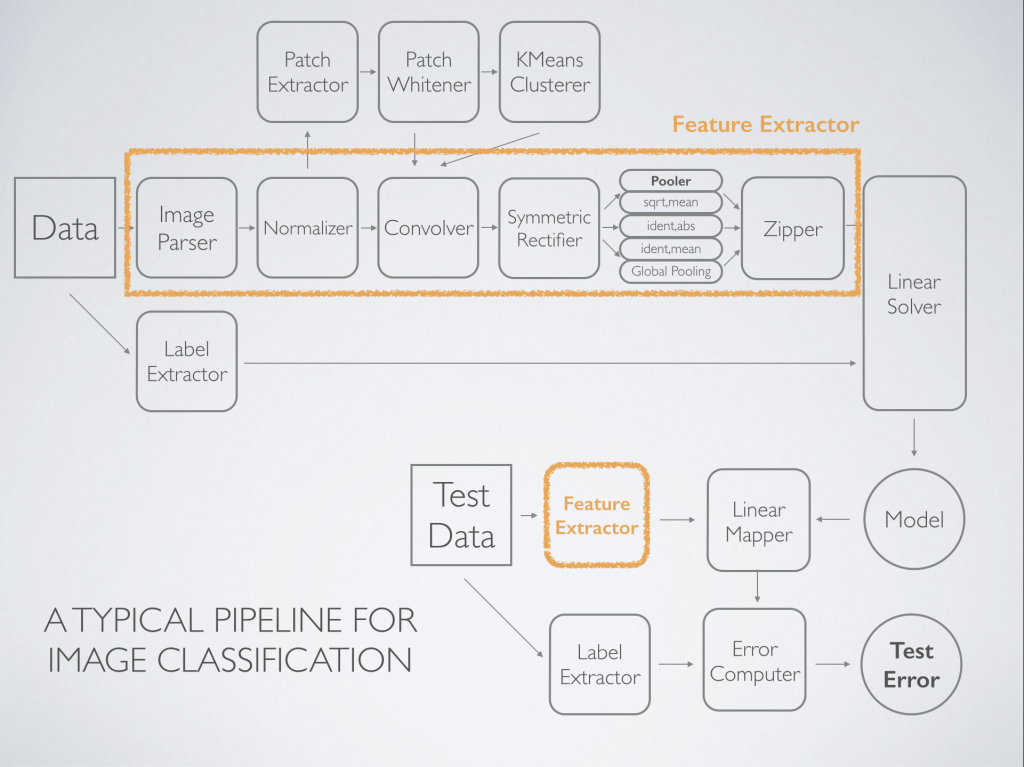
The simple example above is typical of a task like text categorization, but let’s take a look at a typical pipeline for image classification:

A Sample Image Classification Pipeline.

A Sample Image Classification Pipeline.

This more complicated pipeline, inspired by this paper, is representative of what is done commonly done in practice. More examples can be found in this paper. The pipeline consists of several components. First, relevant features are identified after whitening via K-means. Next, featurization of the input images happens via convolution, rectification, and summarization via pooling. Then, the data is in a format ready to be used by a machine learning algorithm – in this case a simple (but extremely fast) linear solver. Finally, we can apply the model to held-out data to evaluate its effectiveness.

This example pipeline consists of operations that are predominantly data-parallel, which implies that running at the scale of terabytes of input images is something that can be achieved easily with Spark. Our system provides fast distributed implementations of these components, provides a APIs for parameterizing and arranging them, and executes them efficiently over a cluster of machines using Spark.

It worth noting that the schematic we’ve shown above starts to look a lot like a query plan in a database system. We plan to explore using techniques from the database systems literature to automate assembly and optimization of these plans by the system, but this is future work.

The ML Pipelines project leverages Apache Spark and MLlib and provides a few key features to make the construction of large scale learning pipelines something that is within reach of academics, data scientists, and developers who are not experts in distributed systems or the implementation of machine learning algorithms. These features are:

  1. Pipeline Construction Framework – A DSL for the construction of pipelines that includes concepts of “Nodes” and “Pipelines”, where Nodes are data transformation steps and pipelines are a DAG of these nodes. Pipelines become objects that can be saved out and applied in real-time to new data.
  2. Examples Nodes – We have implemented a number of example nodes that include domain specific feature transformers (like Daisy and Hog features in image processing) general purpose transformers (like the FFT and Convolutions), as well as statistical utilities and nodes which call into machine learning algorithms provided by MLlib. While we haven’t implemented it, we point out that one “node” could be a so called deep neural network – one possible step in a production workload for predictive analytics
  3. Distributed Matrixes – A fast distributed linear algebra library, with several linear solvers that provide both approximate and exact solutions to large systems of linear equations. Algorithms like block coordinate descent and TSQR and knowledge of the full processing pipeline allow us to apply optimizations like late-materialization of features to scale to feature spaces that can be arbitrarily large.
  4. End-to-end Pipelines – We have created a number of examples that demonstrate the system working end-to-end from raw image, text, and (soon) speech data, which reproduce state-of-the art research results.

This work is part of our ongoing research efforts to simplify access to machine learning and predictive analytics at scale. Watch this space for information about an open-source preview of the software.

This concept of treating complex machine learning workflows a composition of dataflow operators is something that is coming up in a number of systems. Both scikit-learn and GraphLab have the concept of pipelines built into their system. Meanwhile, at the lab we’re working closely with the Spark community to integrate these features into a future release.

Social Influence Bias and the California Report Card

sanjay

This project is in collaboration between the office of Lt. Governor Gavin Newsom with the CITRIS Data and Democracy Initiative and the Algorithms, Machines, and People (AMP) Lab at UC Berkeley.

Californians are using smartphones to grade the state on timely issues. The “California Report Card” (CRC) is a pilot project that aims to increase public engagement with political issues and to help leaders at all levels stay informed about the changing opinions and priorities of their constituents. Anyone can participate by taking a few minutes to assign grades to the state of California on timely issues including healthcare, education, and immigrant rights.  Participants are then invited to propose issues for future versions of the platform. To participate, visit:
http://californiareportcard.org/mobile

careportcard_comic

Since January, we have collected over 15 GB of user activity logs from over 9,000 participants. We use this dataset to study new algorithms and analysis methodologies for crowdsourcing. In a new paper, A Methodology for Learning, Analyzing, and Mitigating Social Influence Bias in Recommender Systems, we explore cleaning and correcting biases that can affect rating systems. Social Influence Bias is defined as the tendency for the crowd to conform (or be contrarian) upon learning opinions of others. A common practice in recommender systems, blogs, and other rating/voting systems is to show an aggregate statistic (eg. average rating of 4 stars, +10 up-votes) before participants submit a rating of their own; which is prone to Social Influence Bias.

The CRC has a novel rating interface that reveals the median grade to participants after they assign a grade of their own as an incentive. After observing the median grade, participants are allowed change their grades, and we record both the initial and final grades. This allows us to isolate the effects of Social Influence Bias, and pose this as a hypothesis testing problem. We tested the hypothesis that changed grades were significantly closer to the observed medians than ones that were not changed. We designed a non-parametric statistical significance test derived from the Wilcoxon Signed-Rank Test to evaluate whether the distribution of grade changes are consistent with Social Influence Bias. The key challenge is that rating data is discrete, multimodal, and that the median grade changed as more participants assigned grades. We concluded that indeed the CRC data suggested a statistically significant tendency for participants to regress towards the median grade. We further ran a randomized survey of 611 subjects through SurveyMonkey without the CRC rating interface and found that this result was still significant with respect to that dataset.

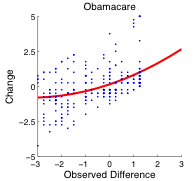
Earlier, in the SampleClean project pdf, we explore scalable data cleaning techniques. As online tools increasingly leverage crowdsourcing and data from people, addressing the unique “dirtiness” of this data such as Social Influence Bias and other psychological biases is an important part of its analysis. We explored building a statistical model to compensate for this bias. Suppose, we only had a dataset of final grades, potentially affected by Social Influence Bias, can we predict the initial pre-biased grades? Our statistical model is Bayesian in construction; we estimate the prior probability that a participant changed their grade conditioned on their other grades. Then if they are likely to have changed their grade (eg. > 50%), we use a polynomial regression to predict the unbiased grade. We optimize our Polynomial Regression Model with the Bayesian Information Criterion to jointly optimize over the model parameters and degree of polynomial. Our surprising result was that the bias was quite predictable and we could “mitigate” the bias in a held-out test set by 76.3%.

sib-poly-regression1sib-bias1

These results  suggest that new interfaces and statistical machine learning techniques have potential to reduce the effects of bias in ratings-based systems such as online surveys and shopping systems. For details on the issues being graded, statistical significance, related projects, FAQ, contact info, etc, please visit the project website: http://californiareportcard.org/

[1] A Methodology for Learning, Analyzing, and Mitigating Social Influence Bias in Recommender Systems. Sanjay Krishnan, Jay Patel, Michael J. Franklin, and Ken Goldberg. To Appear: ACM Conference on Recommender Systems (RecSys). Foster City, CA, USA. Oct 2014.

[2] A Sample-and-Clean Framework for Fast and Accurate Query Processing on Dirty Data. Jiannan Wang, Sanjay Krishnan, Michael J. Franklin, Ken Goldberg, Tova Milo, Tim Kraska. ACM Special Interest Group on Management of Data (SIGMOD), Snowbird, Utah, USA. June 2014

Open Positions in the AMPLab

massie
https://amplab.cs.berkeley.edu/positions/

The AMPLab is comprised of 10 faculty, 8 post-docs and 50 graduate students as well as a dedicated staff of professionals. If you’d like to help us build the next big thing in Big Data, take a look at the open positions in the UC Berkeley AMPLab. We have openings for Software Engineers, Bioinformaticians, Solutions Architects and Devops Engineers.

You’ll work closely with top companies in Silicon Valley, leading medical centers, the Berkeley Institute for Data Science, DARPA and Databricks (a company founded by AMPLab alumni to commercialize Apache Spark). Everything we create in the AMPLab is shared as open-source for the benefit of the broader community.

Collaboration + Open Source = Research Impact

Michael Franklin

The AMPLab was launched in 2011 and has roots going back to 2009 in the earlier RAD Lab project at Berkeley.   Throughout that time, we’ve had a steady stream of research results and have had a large presence in the top publishing venues in Database Systems, Computing Systems and Machine Learning.  However, in the past few months we’ve seen some real indicators that our work is having impact beyond the traditional expectations of a university-based research project.

Clearly, the Spark system, which was developed in the lab, is having a huge impact in the growing Big Data analytics ecosystem.   This week the 2nd Spark Summit is being held in San Francisco.   Tickets to the summit sold out early, with over 1000 attendees for the two-day event, and over 300 people signed up for an in-depth training session (based on our successful AMPCamp series) on the 3rd day.   Spark is now included in all the major Hadoop distributions, and is leading the way in many technical areas, including support for database queries (SQL-on-Hadoop), distributed machine learning, and large-scale graph processing.

Spark is one part of the larger Berkeley Data Analytics Stack (BDAS), which serves as a unifying framework for much of the research being done in the AMPLab.   Students and researchers in the lab continue to expand, improve, and extend the capabilities of BDAS.   Recent additions include the Tachyon in-memory file system, the BlinkDB approximate query processing platform, and even the SparkR interface that allows programs written in the popular statistics language R to run distributed across a spark cluster.   BDAS provides a research context for the varied projects going on in the lab, and gives students the opportunity to address a ready audience of potential users and collaborators.   For example, the SparkR project started off as a class project, but took on a life of its own when some BDAS users found the code on-line and started using it.

A recent post on this blog by Dave Patterson describes another example of real-world impact that comes from the unique combination of collaboration across research domains and development of working systems used in the lab.  When we started the lab several years ago, we identified genomics, and particularly cancer genomics as an important application use case for the BDAS stack; one that could have an impact on a complex and persistent societal problem.   Dave’s motivation was the conviction that if genomics research was becoming increasingly data-intensive, then Computer Scientists focused on data analytics should be able to contribute.   As you can read in the blog post, spark-based code developed in this project has already had real impact, being used to help diagnose a rare life-threatening infectious disease in a young patient, much faster than had been done previously.

Of course, beyond the outsized impacts listed above, we continue to do what any good university research lab does, producing some of the top students graduating across all the fields we work in, and pushing the envelope on the the research agendas of key areas such as Big Data analytics, cloud computing, and all things data.   The research model developed at Berkeley over the past couple decades emphasizes collaboration across domains and continuous development of working systems that embody the research ideas.   In my experience, this combination makes for a vibrant and productive research and learning environment and also happens to make research a lot more fun.