Aggressive Data Skipping for Querying Big Data

Error: Unable to create directory uploads/2024/05. Is its parent directory writable by the server?

As data volumes continue to expand, analytics approaches that require exhaustively scanning data sets become untenable. For this reason, we have been developing data organization techniques that make it possible to avoid looking at large volumes of irrelevant data. Our work in this area, which we call “Aggressive Data Skipping”  recently got picked up by O’Reilly Radar: Data Today: Behind on Predictive Analytics, Aggressive Data Skipping + More. In this post, I give a brief overview the approach and provide references to more detailed publications.

Data skipping is an increasingly popular technique used in modern analytics databases, including IBM DB2 BLU, Vertica, Spark and many others. The idea is very simple:  big data files are partitioned into fairly small blocks of say, 10,000 rows.  For each such block we store some metadata, e.g., the min and max of each column. Before scanning each block, a query can first check the metadata and then decide if the block possibly contains records that are relevant to the query.  If the metadata indicates that no such records are contained in the block, then the block does not need to be read, i.e, it can be skipped altogether.

In our work we focus on maximizing the amount of data that can be skipped (hence the name “Aggressive Data Skipping”). The key to our approach is Workload Analysis.   That is, we observe the queries that are presented to the system over time, and then make partitioning decisions based on what is learned from those observations. Our workload-driven fine-grained partitioning framework re-orders the rows at data loading time.

In order to maximize the chance of data skipping, our research answers the following questions:

  • what partitioning method is appropriate for generating fine-grained blocks
  • what kind of (concise) metadata can we store for supporting arbitrary filters (e.g., string matching or UDF filters)

As shown in the figure below, our approach uses the following “W-A-R-P” steps:

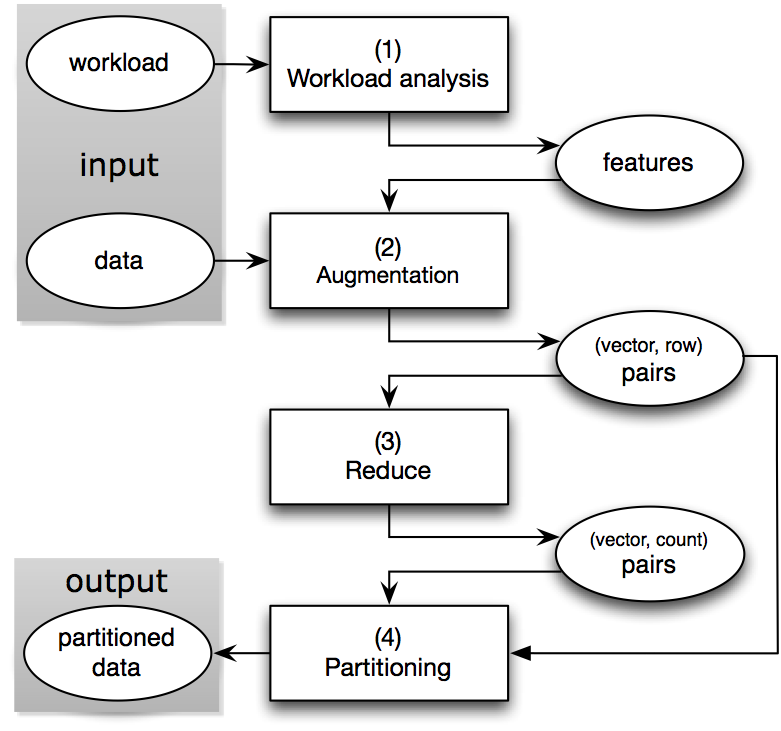
The Partitioning Framework

  • Workload analysis: We extract the frequently recurring filter patterns, which we call the features, from the workload. The workload can be a log of past ad-hoc queries or a collection of query templates from which daily reporting queries are generated.
  • Augmentation: For each row, we compute a bit vector based on the features and augment the row with this vector.
  • Reduce: We group together the rows with the same bit vectors, since the partitioning decision will be solely based on the bit vectors rather than the actual data rows.
  • Partition: We run a clustering algorithm on the bit vectors and generate a partitioning scheme. The rows will be routed to their destination partitions guided by this partitioning scheme.

After we have partitioned the data, we store a feature bit vector for each partition as metadata. The following figure illustrates how data skipping works during query execution.

query

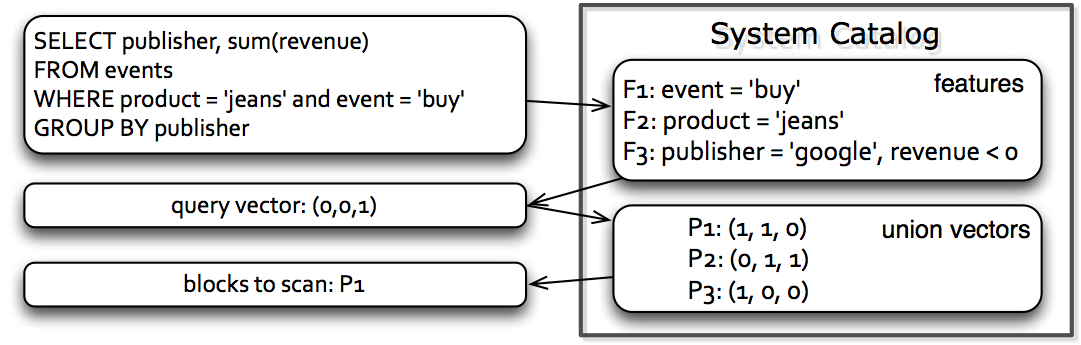
Data skipping during query execution

When a query comes, our system first checks which features are applicable for data skipping. With this information, the query processor then goes through the partition-level metadata (i.e., the bit vectors) and decides which partitions can be skipped. This process can work in conjunction with existing data skipping based on min/max.

We prototyped this framework on Shark and our experiments with TPC-H and a real-world dataset show speed ups of 2x to 7x. An example result from the TPC-H benchmark (measuring average query response time over 80 TPC-H queries) is shown below.
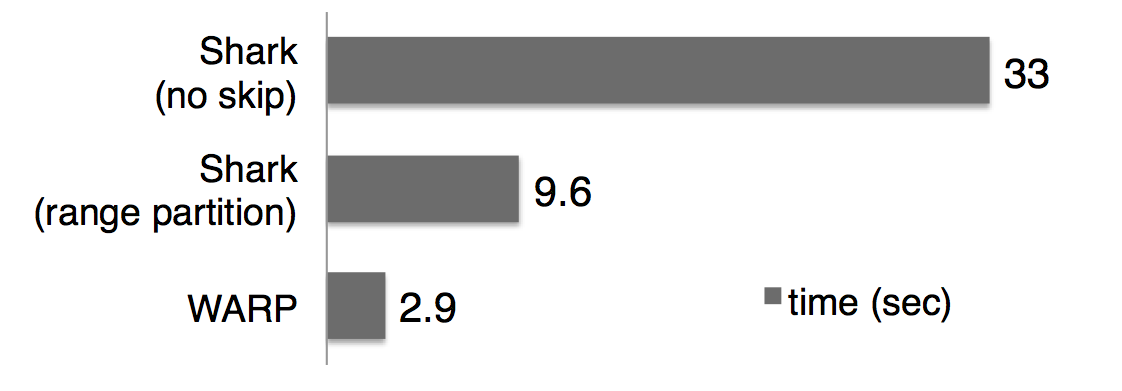
Query Response Time

Query Response Time

For more technical details and results, please read our SIGMOD 14 paper, or if you hate formalism and equations, we also gave a demo in VLDB 14. Feel free to send an email to liwen@cs.berkeley.edu for any questions or comments on this project.

Big Data, Hype, the Media and Other Provocative Words to Put in a Title

Error: Unable to create directory uploads/2024/05. Is its parent directory writable by the server?

I’ve found myself engaged with the Media recently, first in the context of a
“Ask Me Anything” (AMA) with reddit.com http://www.reddit.com/r/MachineLearning/comments/2fxi6v/ama_michael_i_jordan/ (a fun and engaging way to spend a morning), and then for an interview that has been published in the IEEE Spectrum.

That latter process was disillusioning. Well, perhaps a better way to say it is that I didn’t harbor that many illusions about science and technology journalism going in, and the process left me with even fewer.

The interview is here:  http://spectrum.ieee.org/robotics/artificial-intelligence/machinelearning-maestro-michael-jordan-on-the-delusions-of-big-data-and-other-huge-engineering-efforts

Read the title and the first paragraph and attempt to infer what’s in the body of the interview. Now go read the interview and see what you think about the choice of title.

Here’s what I think.

The title contains the phrase “The Delusions of Big Data and Other Huge Engineering Efforts”. It took me a moment to realize that this was the title that had been placed (without my knowledge) on the interview I did a couple of weeks ago. Anyway who knows me, or who’s attended any of my recent talks knows that I don’t feel that Big Data is a delusion at all; rather, it’s a transformative topic, one that is changing academia (e.g., for the first time in my 25-year career, a topic has emerged that almost everyone in academia feels is on the critical path for their sub-discipline), and is changing society (most notably, the micro-economies made possible by learning about individual preferences and then connecting suppliers and consumers directly are transformative). But most of all, from my point of view, it’s a *major engineering and mathematical challenge*, one that will not be solved by just gluing together a few existing ideas from statistics, optimization, databases and computer systems.

I.e., the whole point of my shtick for the past decade is that Big Data is a Huge Engineering Effort and that that’s no Delusion. Imagine my dismay at a title that said exactly the opposite.

The next phrase in the title is “Big Data Boondoggles”. Not my phrase, nor my thought. I don’t talk that way. Moreover, I really don’t see anything wrong with anyone gathering lots of data and trying things out, including trying out business models; quite to the contrary. It’s the only way we’ll learn. (Indeed, my bridge analogy from later in the article didn’t come out quite right: I was trying to say that historically it was crucial for humans to start to build bridges, and trains, etc, etc, before they had serious engineering principles in place; the empirical engineering effort had immediate positive effects on humans, and it eventually led to the engineering principles. My point was just that it’s high time that we realize that wrt to Big Data we’re now at the “what are the principles?” point in time. We need to recognize that poorly thought-out approaches to large-scale data analysis can be just costly as bridges falling down. E.g., think individual medical decision-making, where false positives can, and already are, leading to unnecessary surgeries and deaths.)

Next, in the first paragraph, I’m implied to say that I think that neural-based chips are “likely to prove a fool’s errand”. Not my phrase, nor my thought. I think that it’s perfectly reasonable to explore such chip-building; it’s even exciting. As I mentioned in the interview, I do think that a problem with that line of research is that they’re putting architecture before algorithms and understanding, and that’s not the way I’d personally do things, but others can beg to differ, and by all I means think that they should follow their instincts.

The interview then proceeds along, with the interviewer continually trying to get me to express black-and-white opinions about issues where the only reasonable response is “gray”, and where my overall message that Big Data is Real but that It’s a Huge Engineering Challenge Requiring Lots of New Ideas and a Few Decades of Hard Work keeps getting lost, but where I (valiantly, I hope) resist. When we got to the Singularity and quantum computing, though—areas where no one in their right mind will imagine that I’m an expert—I was despairing that the real issues I was trying to have a discourse about were not really the point of the interview and I was glad that the hour was over.

Well, at least the core of the article was actually me in my own words, and I’m sure that anyone who actually read it realized that the title was misleading (at best).

But why should an entity such as the IEEE Spectrum allow an article to be published where the title is a flat-out contradiction to what’s actually in the article?

I can tell you why: It’s because this title and this lead-in attracted an audience.

And it was precisely this issue that I alluded to in my response to the first question—i.e., that the media, even the technology media that should know better, has become a hype-creator and a hype-amplifier. (Not exactly an original thought; I know…). The interviewer bristled, saying that the problem is that academics put out press releases that are full of hype and the poor media types don’t know how to distinguish the hype from the truth. I relented a bit. And, sure, he’s right, there does seem to be a growing tendency among academics and industrial researchers to trumpet their results rather than just report them.

But I didn’t expect to become a case in point. Then I saw the title and I realized that I had indeed become a case in point. I.e., here we have a great example of exactly what I was talking about—the media willfully added some distortion and hype to a story to increase the readership. Having the title be “Michael Jordan Says Some Reasonable, But Somewhat Dry, Academic, Things About Big Data” wouldn’t have attracted any attention.

(Well “Michael Jordan” and “Big Data” would have attracted at least some attention, I’m afraid, but you get my point.)

(As for “Maestro”, usually drummers aren’t referred to as “Maestros”, so as far as that bit of hyperbole goes I’m not going to complain… :-).

Anyway, folks, let’s do our research, try to make society better, enjoy our lives and forgo the attempts to become media darlings. As for members of the media, perhaps the next time you consider adding that extra dollop of spin or hype… Please. Don’t.

Mike Jordan

ML Pipelines

Error: Unable to create directory uploads/2024/05. Is its parent directory writable by the server?

Recently at the AMP Lab, we’ve been focused on building application frameworks on top of the BDAS stack. Projects like GraphX, MLlib/MLI, Shark, and BlinkDB have leveraged the lower layers of the stack to provide interactive analytics at unprecedented scale across a variety of application domains. One of the projects that we have focused on over the last several months we have been calling “ML Pipelines”, an extension of our earlier work on MLlib and is a component of MLbase.

In real-world applications – both academic and industrial – use of a machine learning algorithm is only one component of a predictive analytic workflow. Pre-processing steps and considerations about production deployment must also be taken into account. For example, in text classification, preprocessing steps like n-gram extraction, and TF-IDF feature weighting are often necessary before training of a classification model like an SVM. When it comes time to deploy the model, your system must not only know the SVM weights to apply to input features, but also how to get your raw data into the same format that the model is trained on.

The simple example above is typical of a task like text categorization, but let’s take a look at a typical pipeline for image classification:

A Sample Image Classification Pipeline.

A Sample Image Classification Pipeline.

This more complicated pipeline, inspired by this paper, is representative of what is done commonly done in practice. More examples can be found in this paper. The pipeline consists of several components. First, relevant features are identified after whitening via K-means. Next, featurization of the input images happens via convolution, rectification, and summarization via pooling. Then, the data is in a format ready to be used by a machine learning algorithm – in this case a simple (but extremely fast) linear solver. Finally, we can apply the model to held-out data to evaluate its effectiveness.

This example pipeline consists of operations that are predominantly data-parallel, which implies that running at the scale of terabytes of input images is something that can be achieved easily with Spark. Our system provides fast distributed implementations of these components, provides a APIs for parameterizing and arranging them, and executes them efficiently over a cluster of machines using Spark.

It worth noting that the schematic we’ve shown above starts to look a lot like a query plan in a database system. We plan to explore using techniques from the database systems literature to automate assembly and optimization of these plans by the system, but this is future work.

The ML Pipelines project leverages Apache Spark and MLlib and provides a few key features to make the construction of large scale learning pipelines something that is within reach of academics, data scientists, and developers who are not experts in distributed systems or the implementation of machine learning algorithms. These features are:

  1. Pipeline Construction Framework – A DSL for the construction of pipelines that includes concepts of “Nodes” and “Pipelines”, where Nodes are data transformation steps and pipelines are a DAG of these nodes. Pipelines become objects that can be saved out and applied in real-time to new data.
  2. Examples Nodes – We have implemented a number of example nodes that include domain specific feature transformers (like Daisy and Hog features in image processing) general purpose transformers (like the FFT and Convolutions), as well as statistical utilities and nodes which call into machine learning algorithms provided by MLlib. While we haven’t implemented it, we point out that one “node” could be a so called deep neural network – one possible step in a production workload for predictive analytics
  3. Distributed Matrixes – A fast distributed linear algebra library, with several linear solvers that provide both approximate and exact solutions to large systems of linear equations. Algorithms like block coordinate descent and TSQR and knowledge of the full processing pipeline allow us to apply optimizations like late-materialization of features to scale to feature spaces that can be arbitrarily large.
  4. End-to-end Pipelines – We have created a number of examples that demonstrate the system working end-to-end from raw image, text, and (soon) speech data, which reproduce state-of-the art research results.

This work is part of our ongoing research efforts to simplify access to machine learning and predictive analytics at scale. Watch this space for information about an open-source preview of the software.

This concept of treating complex machine learning workflows a composition of dataflow operators is something that is coming up in a number of systems. Both scikit-learn and GraphLab have the concept of pipelines built into their system. Meanwhile, at the lab we’re working closely with the Spark community to integrate these features into a future release.

Social Influence Bias and the California Report Card

Error: Unable to create directory uploads/2024/05. Is its parent directory writable by the server?

This project is in collaboration between the office of Lt. Governor Gavin Newsom with the CITRIS Data and Democracy Initiative and the Algorithms, Machines, and People (AMP) Lab at UC Berkeley.

Californians are using smartphones to grade the state on timely issues. The “California Report Card” (CRC) is a pilot project that aims to increase public engagement with political issues and to help leaders at all levels stay informed about the changing opinions and priorities of their constituents. Anyone can participate by taking a few minutes to assign grades to the state of California on timely issues including healthcare, education, and immigrant rights.  Participants are then invited to propose issues for future versions of the platform. To participate, visit:
http://californiareportcard.org/mobile

careportcard_comic

Since January, we have collected over 15 GB of user activity logs from over 9,000 participants. We use this dataset to study new algorithms and analysis methodologies for crowdsourcing. In a new paper, A Methodology for Learning, Analyzing, and Mitigating Social Influence Bias in Recommender Systems, we explore cleaning and correcting biases that can affect rating systems. Social Influence Bias is defined as the tendency for the crowd to conform (or be contrarian) upon learning opinions of others. A common practice in recommender systems, blogs, and other rating/voting systems is to show an aggregate statistic (eg. average rating of 4 stars, +10 up-votes) before participants submit a rating of their own; which is prone to Social Influence Bias.

The CRC has a novel rating interface that reveals the median grade to participants after they assign a grade of their own as an incentive. After observing the median grade, participants are allowed change their grades, and we record both the initial and final grades. This allows us to isolate the effects of Social Influence Bias, and pose this as a hypothesis testing problem. We tested the hypothesis that changed grades were significantly closer to the observed medians than ones that were not changed. We designed a non-parametric statistical significance test derived from the Wilcoxon Signed-Rank Test to evaluate whether the distribution of grade changes are consistent with Social Influence Bias. The key challenge is that rating data is discrete, multimodal, and that the median grade changed as more participants assigned grades. We concluded that indeed the CRC data suggested a statistically significant tendency for participants to regress towards the median grade. We further ran a randomized survey of 611 subjects through SurveyMonkey without the CRC rating interface and found that this result was still significant with respect to that dataset.

Earlier, in the SampleClean project pdf, we explore scalable data cleaning techniques. As online tools increasingly leverage crowdsourcing and data from people, addressing the unique “dirtiness” of this data such as Social Influence Bias and other psychological biases is an important part of its analysis. We explored building a statistical model to compensate for this bias. Suppose, we only had a dataset of final grades, potentially affected by Social Influence Bias, can we predict the initial pre-biased grades? Our statistical model is Bayesian in construction; we estimate the prior probability that a participant changed their grade conditioned on their other grades. Then if they are likely to have changed their grade (eg. > 50%), we use a polynomial regression to predict the unbiased grade. We optimize our Polynomial Regression Model with the Bayesian Information Criterion to jointly optimize over the model parameters and degree of polynomial. Our surprising result was that the bias was quite predictable and we could “mitigate” the bias in a held-out test set by 76.3%.

sib-poly-regression1sib-bias1

These results  suggest that new interfaces and statistical machine learning techniques have potential to reduce the effects of bias in ratings-based systems such as online surveys and shopping systems. For details on the issues being graded, statistical significance, related projects, FAQ, contact info, etc, please visit the project website: http://californiareportcard.org/

[1] A Methodology for Learning, Analyzing, and Mitigating Social Influence Bias in Recommender Systems. Sanjay Krishnan, Jay Patel, Michael J. Franklin, and Ken Goldberg. To Appear: ACM Conference on Recommender Systems (RecSys). Foster City, CA, USA. Oct 2014.

[2] A Sample-and-Clean Framework for Fast and Accurate Query Processing on Dirty Data. Jiannan Wang, Sanjay Krishnan, Michael J. Franklin, Ken Goldberg, Tova Milo, Tim Kraska. ACM Special Interest Group on Management of Data (SIGMOD), Snowbird, Utah, USA. June 2014

Open Positions in the AMPLab

Error: Unable to create directory uploads/2024/05. Is its parent directory writable by the server?
https://amplab.cs.berkeley.edu/positions/

The AMPLab is comprised of 10 faculty, 8 post-docs and 50 graduate students as well as a dedicated staff of professionals. If you’d like to help us build the next big thing in Big Data, take a look at the open positions in the UC Berkeley AMPLab. We have openings for Software Engineers, Bioinformaticians, Solutions Architects and Devops Engineers.

You’ll work closely with top companies in Silicon Valley, leading medical centers, the Berkeley Institute for Data Science, DARPA and Databricks (a company founded by AMPLab alumni to commercialize Apache Spark). Everything we create in the AMPLab is shared as open-source for the benefit of the broader community.

Collaboration + Open Source = Research Impact

Error: Unable to create directory uploads/2024/05. Is its parent directory writable by the server?

The AMPLab was launched in 2011 and has roots going back to 2009 in the earlier RAD Lab project at Berkeley.   Throughout that time, we’ve had a steady stream of research results and have had a large presence in the top publishing venues in Database Systems, Computing Systems and Machine Learning.  However, in the past few months we’ve seen some real indicators that our work is having impact beyond the traditional expectations of a university-based research project.

Clearly, the Spark system, which was developed in the lab, is having a huge impact in the growing Big Data analytics ecosystem.   This week the 2nd Spark Summit is being held in San Francisco.   Tickets to the summit sold out early, with over 1000 attendees for the two-day event, and over 300 people signed up for an in-depth training session (based on our successful AMPCamp series) on the 3rd day.   Spark is now included in all the major Hadoop distributions, and is leading the way in many technical areas, including support for database queries (SQL-on-Hadoop), distributed machine learning, and large-scale graph processing.

Spark is one part of the larger Berkeley Data Analytics Stack (BDAS), which serves as a unifying framework for much of the research being done in the AMPLab.   Students and researchers in the lab continue to expand, improve, and extend the capabilities of BDAS.   Recent additions include the Tachyon in-memory file system, the BlinkDB approximate query processing platform, and even the SparkR interface that allows programs written in the popular statistics language R to run distributed across a spark cluster.   BDAS provides a research context for the varied projects going on in the lab, and gives students the opportunity to address a ready audience of potential users and collaborators.   For example, the SparkR project started off as a class project, but took on a life of its own when some BDAS users found the code on-line and started using it.

A recent post on this blog by Dave Patterson describes another example of real-world impact that comes from the unique combination of collaboration across research domains and development of working systems used in the lab.  When we started the lab several years ago, we identified genomics, and particularly cancer genomics as an important application use case for the BDAS stack; one that could have an impact on a complex and persistent societal problem.   Dave’s motivation was the conviction that if genomics research was becoming increasingly data-intensive, then Computer Scientists focused on data analytics should be able to contribute.   As you can read in the blog post, spark-based code developed in this project has already had real impact, being used to help diagnose a rare life-threatening infectious disease in a young patient, much faster than had been done previously.

Of course, beyond the outsized impacts listed above, we continue to do what any good university research lab does, producing some of the top students graduating across all the fields we work in, and pushing the envelope on the the research agendas of key areas such as Big Data analytics, cloud computing, and all things data.   The research model developed at Berkeley over the past couple decades emphasizes collaboration across domains and continuous development of working systems that embody the research ideas.   In my experience, this combination makes for a vibrant and productive research and learning environment and also happens to make research a lot more fun.

SNAP Helps Save A Life

Error: Unable to create directory uploads/2024/05. Is its parent directory writable by the server?

When we got started in genomics 3 years ago, I wrote an essay in the New York Times that computer scientists have a lot to bring to the fight deadly diseases like cancer. (This hypothesis was not universally heralded by everyone in all fields.)

The good news we have already had a success of using SNAP for infectious disease to help save a life.

There are a number of patients in the hospital with undiagnosed inflammatory reactions and infectious symptoms who have no identifiable source using existing tests. A generic test to identify all organisms using RNA sequencing has been developed and is being piloted by Dr. Charles Chiu at UCSF. SNAP is critical to the implementation of this test, since it rapidly filters all human sequence from the large resulting datasets (up to 100 million sequences), enabling the identification of pathogenic sequence within a small enough time to effectively treat patients. In the US 20,000 people, mostly children, are hospitalized each year with brain-swelling encephalitis, and 60% of the time doctors never find the cause, which can lead to serious consequences.

Joshua Osborn, now 15, outside his home in Cottage Grove, Wis

Joshua Osborn, now 15, outside his home in Cottage Grove, Wis

This tool was recently used to successfully diagnose and treat a Joshua Osborn, a teenager with severe combined immunodeficiency who lives in Wisconsin. He went to hospital repeatedly, and was eventually hospitalized for 5 weeks without successful diagnosis. He developed brain seizures, so he was placed in a medically induced coma. In desperation, they asked his parents to try one more experimental test. His parents agreed, so they sampled his spinal fluid and sent it to UCSF for sequencing and analysis.

The speed and accuracy of SNAP helped UCSF to quickly filter out the human reads. In just 2 days they identified a rare infectious bacterium, which was only 0.02% of the original 3M reads. The boy was then treated with antibiotics for 10 days; he awoke and was discharged from the hospital 4 weeks later. Although our software is only part of this process, without SNAP it would not be possible to perform a general infectious disease test like this without first guessing the causative agent. That’s why tests such as this are not yet more broadly available.

Quoting from the UCSF press release, referring indirectly in part to the speed and accuracy of SNAP:

“This analysis of DNA sequences required just 96 minutes. A similar analysis conducted with the use of previous generations of computational software on the same hardware platform would have taken 24 hours or more to complete,” Chiu said.

The abstract and last paragraph from the NEJM article tells the story with more medical accuracy and brevity:

A 14-year-old boy with severe combined immunodeficiency presented three times to a medical facility over a period of 4 months with fever and headache that progressed to hydrocephalus and status epilepticus necessitating a medically induced coma. Diagnostic workup including brain biopsy was unrevealing. Unbiased next-generation sequencing of the cerebrospinal fluid identified 475 of 3,063,784 sequence reads (0.016%) corresponding to leptospira infection. Clinical assays for leptospirosis were negative. Targeted antimicrobial agents were administered, and the patient was discharged home 32 days later with a status close to his premorbid condition. Polymerase-chain-reaction (PCR) and serologic testing at the Centers for Disease Control and Prevention (CDC) subsequently confirmed evidence of Leptospira santarosai infection.

… In summary, unbiased next-generation sequencing coupled with a rapid bioinformatics pipeline provided a clinically actionable diagnosis of a specific infectious disease from an uncommon pathogen that eluded conventional testing for months after the initial presentation. This approach thus facilitated the use of targeted and efficacious antimicrobial therapy.

In a separate communication with Chiu he said that in the United States, there are about 15,000 cases a year of brain-swelling encephalitis with 2,000 deaths, and >70% of the deaths underdiagnosed. Assuming doctors are able to obtain actionable diagnoses from the information, SNAP plus the software developed at UCSF to identify the non-human reads (SUPRI) could potentially save the lives hundreds of encephalitis patients annually just in the US. Worldwide, encephalitis is a huge problem; there are probably about 70,000 diagnosed cases a year with 25,000 deaths. Even 25,000 is certainly a gross underestimate because most cases worldwide are in rural areas and do not receive hospital care.

Here are links to

  • the New York Times article,
  • the press release from UCSF,
  • the New England Journal of Medicine article that describes the boy’s treatment, and
  • the technical paper in Genomics Research that describes the UCSF work that discovered the disease, which talks about the use of SNAP and SUPRI and cites our paper.
  • Benefiting from Science is a Human Right!

    Error: Unable to create directory uploads/2024/05. Is its parent directory writable by the server?

    I was just at the Global Alliance for Genomics and Health (GA4GH) last week in London, and a person from the regulatory and ethics group quoted the United Nations about the rights for people to benefit from scientific progress:

    Article 27.1 of The Universal Declaration of Human Rights states
    “Everyone has the right freely to participate in the cultural life of the community, to enjoy the arts and to share in scientific advancement and its benefits.”

    As almost all nations have signed this treaty, it has the power of law.

    This declaration is a big deal in genomics because, under the argument of protecting their privacy, some experts would prevent people from benefiting from scientific progress by preventing them from sharing their genomes with scientists. The experts argue that people don’t understand what they are doing, and hence they must be protected from themselves. Article 27.1 is a counterargument, in that benefiting participating in and benefiting from scientific progress is a human right, and you must be careful not to trample human rights

    PLANET: Making Progress with Commits in Unpredictable Environments

    Error: Unable to create directory uploads/2024/05. Is its parent directory writable by the server?

    Recent trends in databases, such as multi-tenancy and cloud databases, can contribute to increases in delays and variation for transaction response times. For geo-replicated databases, this issue can be even worse, since the network delays between data centers can be very unpredictable. Developers have two options when transactions are delayed unpredictably: they may choose to wait indefinitely for the transaction to complete, or they may timeout early and be uncertain of the transaction outcome. Neither outcome is desirable, so we propose a new transaction programming model to help with this situation.

    planet_logo_small

    We propose PLANET (Predictive Latency-Aware NEtworked Transactions), which is a new transaction programming model that helps developers write flexible transactions. By using PLANET, developers can write transactions to better deal with the variation in latencies possible in modern database environments. PLANET provides the developer with more information of the progress and stages of the transaction, so the developer can define how the transaction should behave in different situations. By exposing more details, PLANET enables developers to express user-defined commits for their transactions. PLANET also exposes a commit likelihood calculation for transactions, which can be utilized for user-defined commits as well as admission control. By using the features of PLANET, systems can provide responsive transactions, as well as better system utilization for cloud databases.

    More information about PLANET can be found at our PLANET website. There, we have a simple interactive visualization to demonstrate how some of the features of PLANET work. We also have examples of several use cases of the transaction programming model.

    planet_stages

    New BDAS Features

    Error: Unable to create directory uploads/2024/05. Is its parent directory writable by the server?

    In this post we briefly describe four of the newest features in the Berkeley Data Analytics Stack (BDAS):

    1. GraphX: large-scale interactive graph analytics
    2. BlinkDB: real-time analytics through bounded approximations
    3. MLbase: scalable machine learning library
    4. Tachyon: reliable data sharing at memory speed across cluster frameworks

    GraphX

    GraphX is a distributed interactive graph computation system integrated with Spark.  GraphX exposes a new API that treats tables and graphs as composable objects enabling users to easily construct graphs from tables, join graphs and tables, and apply iterative graph algorithms (e.g., PageRank and community detection) using Pregel like operators.  The GraphX system combines recent advances in graph processing systems with distributed join optimizations and lineage to efficiently execute distributed graph computation in the context of fully fault-tolerant data-parallel platform.  On top of GraphX we have built a collection of useful tools for graph analytics.

    BlinkDB

    BlinkDB is a large-scale data warehouse system built on Shark and Spark that  aims to achieve real-time (i.e., sub-second) query response times for a variety of SQL-based aggregation queries (augmented by a time and/or error bound) on massive amounts of data. This is enabled by not looking at all the data, but rather operating on statistical samples of the underlying datasets. More precisely, BlinkDB gives the user the ability to trade between the accuracy of the results and the time it takes to compute queries. The challenge is to ensure that query results are still meaningful, even though only a subset of the data has been processed. Here we leverage recent advances in statistical machine learning and query processing. Using statistical bootstrapping, we can resample the data in parallel to compute confidence intervals that tell the quality of the sampled results.

    MLbase

    The MLbase project’s aim is to provide fast, scalable, and easy to use Machine Learning on top of Spark and is composed of three core components.   MLlib is the first production-ready component of the MLbase project and is the standard library for machine learning on Spark.  Released as part of Spark 0.8.0, MLlib includes fast, scalable algorithms for classification, regression, clustering, collaborative filtering, and convex optimization.  The second component of MLbase, MLI, is an API for distributed machine learning. By offering an API that is familiar to Machine Learning developers, MLI provides a DSL for development of new machine learning algorithms on top of Spark.  The final component of MLbase, the MLbase Optimizer, attempts to automate the process of model selection and ML pipeline construction, and is an area of active research within the AMPlab.

    Tachyon

    Tachyon is a fault-tolerant distributed file system, which enables reliable file sharing at memory-speed across cluster frameworks, such as Spark and MapReduce. Tachyon achieves memory-speed and fault-tolerance by using memory aggressively and leveraging lineage information. Tachyon caches working set files in memory, and enables different jobs/queries and frameworks to access cached files at memory speed. Thus, Tachyon avoids going to disk to load datasets that are frequently read.

    Learn more at Strata

    At Strata 2014 we will be hosting AMPCamp4 with hands-on exercises (available online as well) to help people get started using BDAS and the exciting new features we have been developing.

    You can register here for AMP Camp 4 and the 2014 Strata Conference. Use the code AMP20 when registering to get 20% off your ticket price. The conference offers one day of tutorials (Feb 11) and two says of presentations (Feb 12-13). Please make sure to select the tutorials day if you wish to join us at the AMP Camp.